
ℹ️ Introduction
This article explains how to use Ardens Manager to monitor and manage Continuity of Care using the RAG (Red, Amber, Green) model. By the end of this article, you will be able to identify patients based on continuity risk and take action to support more consistent, person-centred care.
Background
Continuity of care refers to patients consistently seeing the same clinician or care team over time.
Higher continuity is associated with:
Improved patient outcomes
Better patient experience
Reduced unplanned care and hospital admissions
The Continuity of Care RAG model groups patients based on their level of continuity:
Red – Patients have a high need and would benefit most from a consistent clinician/team
Amber – Patients have a moderate need and would benefit from some level of consistency
Green – Patients have a low need and can be managed flexibly
This model is based on activity recorded in the clinical system, including factors such as how often a patient is seen, how many different clinicians they see, and patterns of interaction over time. It can be used to identify patients who may benefit from a more coordinated approach to care. Unlike some risk stratification tools, continuity status can also be actively managed and recorded within the clinical system, allowing practices to take a proactive approach.
The Continuity of Care resources are built on the Foundry Healthcare operational model, which segments patients based on level of need. This was referenced in the Fuller Stocktake Report as an approach to support improved access and reduce avoidable hospital admissions through systematic triage and clinical judgement. For more information and support on implementation, visit the Foundry Healthcare website.
How Ardens Can Help
Ardens Manager provides visibility of Continuity of Care status across your population, allowing you to identify patients with low continuity and prioritise intervention.
The dashboard allows you to:
Identify patients by RAG status
Differentiate between a recorded and predicted status
Monitor continuity across your population
Apply continuity filters to any report
Target patients for proactive review
This supports a more structured and proactive approach to improving continuity.
✅Included in Ardens Manager National Content package: Interested in finding out more or requesting a trial? Contact accounts@ardens.org.uk
📍 Access Continuity of Care
Population-level registers
Login to Ardens Manager
Select Services from the panel on the left
Select the Population Dashboard
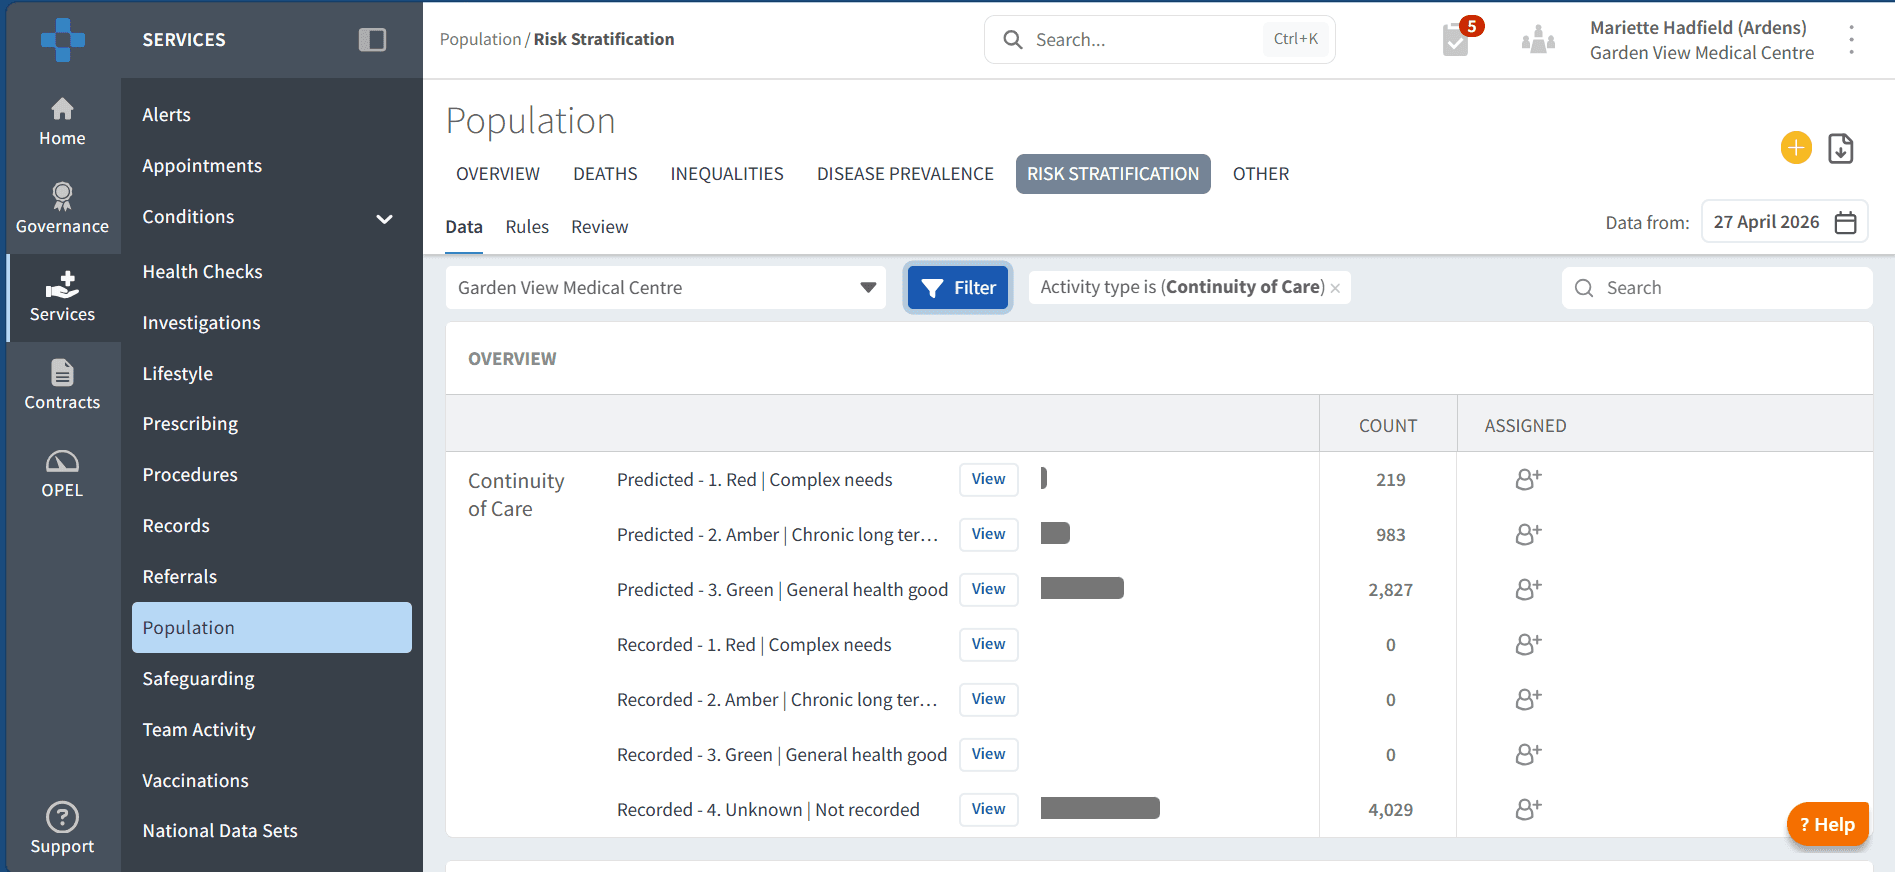
Navigate to the Risk Stratification tab
Locate Continuity of Care RAG section
Use within reports
Continuity of Care RAG can also be applied within any report in Ardens Manager.
To access this:
Click View next to a report
Select the RISK tab

📂Categories
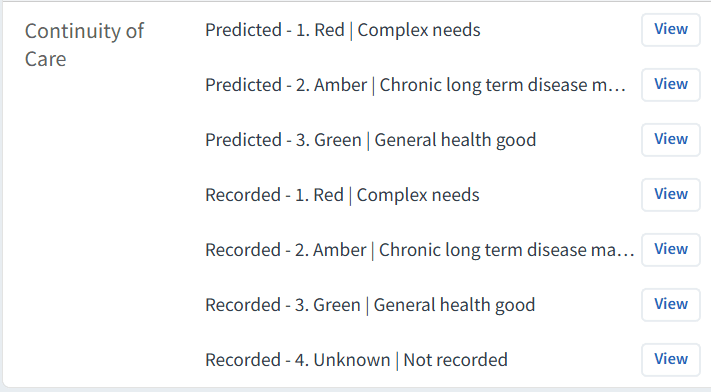
The Continuity of Care register groups patients by RAG rating. The registers are divided into two categories:
Predicted – Based on activity and interaction patterns recorded in the clinical system (e.g. frequency of appointments and number of clinicians seen), indicating the likely continuity need. Includes the most recent recorded status where available.
Recorded – Based solely on a coded status added directly to the patient record using clinical judgement, allowing practices to define continuity need.
🔎 Identify Patients by Status
Target cohorts within reports
Continuity of Care can be applied to any existing cohort to support targeted analysis and prioritisation.
To apply filters:
Click View next to any report
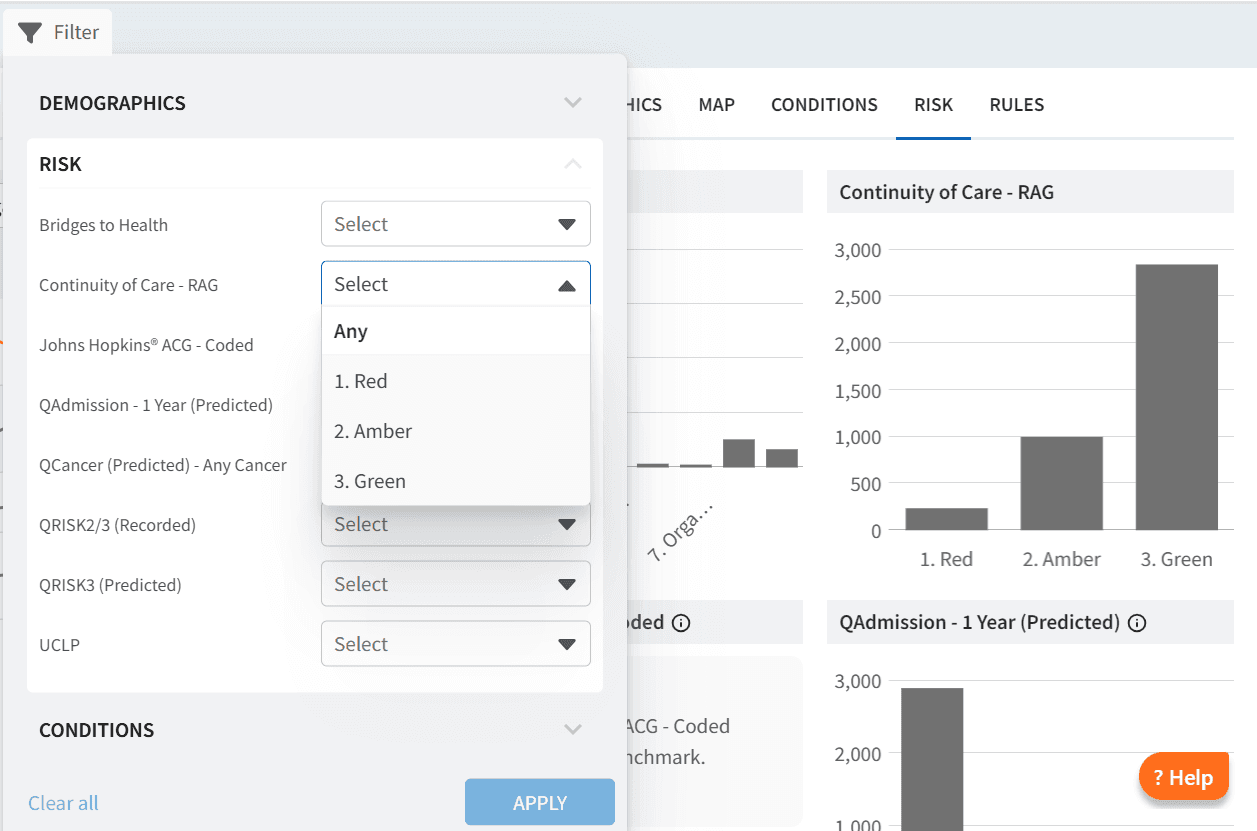
Select the RISK tab
Open the Filter
Choose Continuity of Care RAG
Select the desired category (Red, Amber, Green)
Click APPLY
Use this to:
Focus on patients with low continuity within specific cohorts
Combine continuity data with clinical or operational data
Prioritise interventions based on need
Patient-level review
To view patient-level data:
Click View next to a report
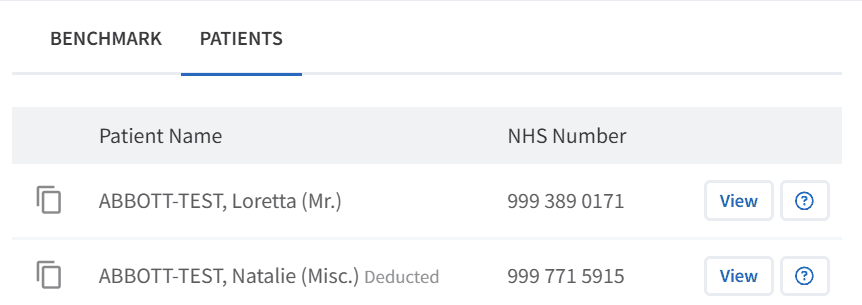
Select the PATIENTS tab
Open Patient View for individual records
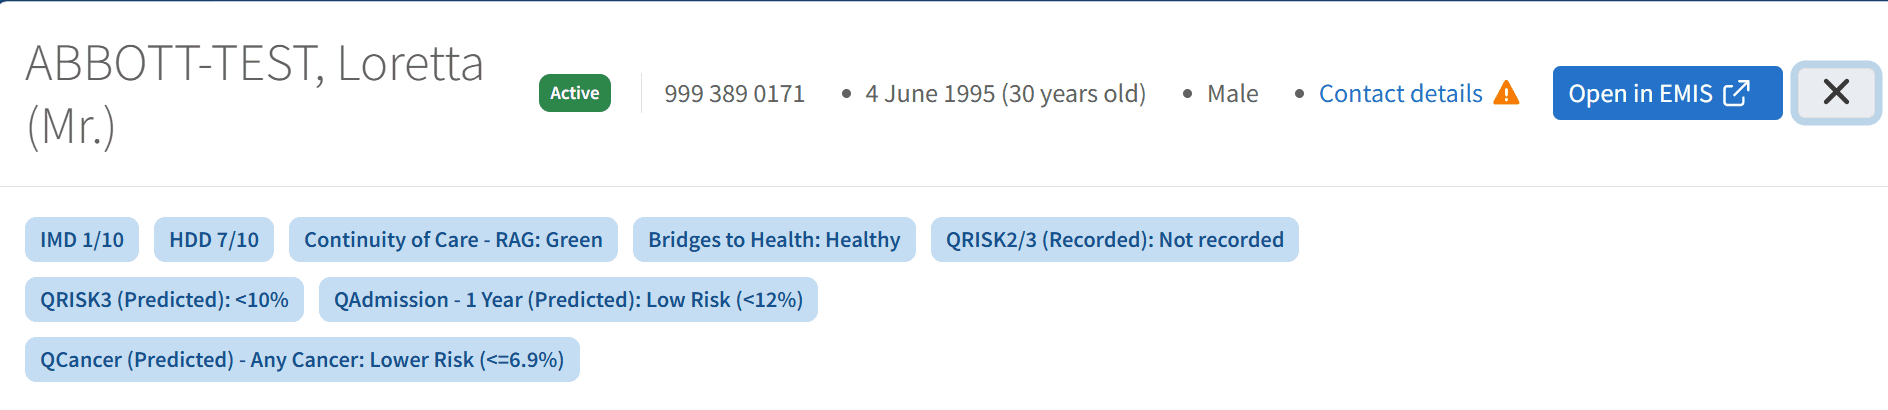
Within Patient View:
Bridges to Health category is displayed alongside other risk stratification tools
This allows comparison across multiple risk models
Supports targeted review and follow-up activity
Select Open in EMIS/SystmOne to launch the full clinical record
👥 Managing Continuity of Care
Continuity of Care status is derived from activity recorded in the clinical system and can also be influenced by locally recorded codes.
To manage continuity:
Review the patient’s clinical record
Ensure relevant activity is coded accurately
Apply or update continuity-related coding where appropriate
This ensures that continuity status reflects the true care relationship and supports more accurate reporting. It also allows all staff, including non-clinical teams, to clearly identify a patient’s continuity status at the point of care (for example when booking appointments), supporting a more consistent and coordinated approach.
For step-by-step guidance on recording and managing continuity of care within EMIS or SystmOne, please refer to the dedicated clinical system support article.
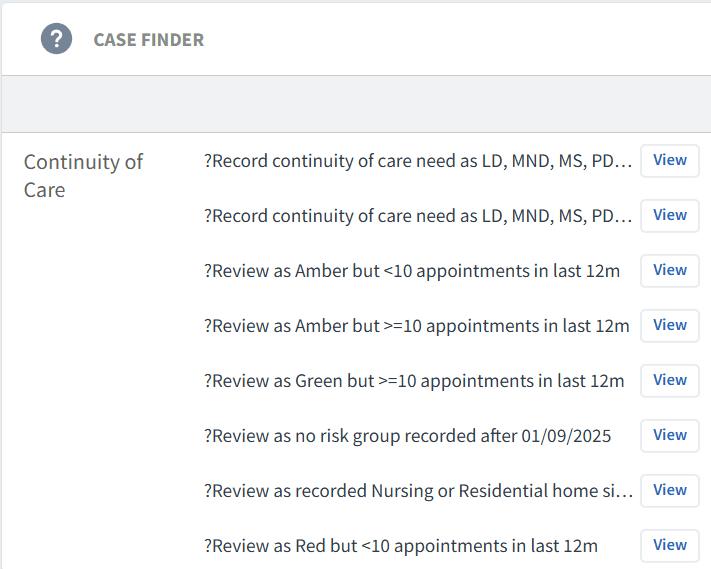
Case Finders
The Case Finder reports help validate and improve the accuracy of recorded continuity status. These reports support identification of patients who may require a review of their current continuity classification, based on either clinical coding history or recent appointment activity.
They include patients who may:
Have a recorded continuity status based on historical coding but have not had recent review or updated mental health coding
Have a missing or outdated recorded status where clinical information suggests a continuity classification should be applied
Have a mismatch between recorded continuity status and recent service use patterns
Use this section to:
Identify patients where continuity status may need updating
Support review of outdated or missing coding
Ensure continuity classification reflects current patterns of care
Improve accuracy of both predicted and recorded datasets
This helps ensure continuity status remains clinically meaningful and aligned with actual patient activity.
🎯 Take Action
Using Continuity of Care data, practices and PCNs can:
Prioritise patients with who may benefit the most from continuity for review
Assign a usual GP or care coordinator
Support more consistent clinician-patient relationships
Improve care planning for complex patients
The aim is to move from fragmented, reactive care to more coordinated, person-centred care.
❓ FAQs
Can continuity status be changed?
Yes, continuity status can be coded within the clinical system to reflect clinical judgement.
What is the difference between predicted and recorded status?
Predicted status is based on existing coding, activity and interaction patterns, while recorded status is manually recorded in the clinical system only.
Should all Red patients be reviewed?
Prioritisation is recommended, focusing on patients with complex needs or high service use.
Can I apply continuity filters to other reports?
Yes, the Continuity of Care RAG model can be applied using the RISK tab across reports.
Where do I update continuity of care?
Continuity is managed within the clinical system. Refer to the relevant EMIS or SystmOne support article for guidance.
When using the RISK breakdown tab, how do I know whether patients are recorded or predicted?
The RISK breakdown tab displays a single combined view of Continuity of Care RAG status.
The report logic first checks for a recorded continuity status coded in the clinical system. Where this exists it will be used. If no recorded status is present, the report will apply the model logic to generate a predicted status based on patient activity. This means the breakdown shows the effective status used for reporting, rather than separating recorded and predicted cohorts.
Why are there two categories for Continuity of Care (Predicted and Recorded)?
The two categories reflect two ways of determining Continuity of Care status:
Recorded status is based on a code added in the clinical system using clinical judgement. This allows practices to apply their own definition of continuity where appropriate.
Predicted status is generated by the model where no recorded status exists, based on patient activity and interaction patterns.
This dual approach ensures full population coverage while still allowing practices to apply local clinical judgement. You can also use the breakdown to understand how many patients are recorded versus predicted, which may help identify where clinical coding is being actively used and where the model is applying default logic.
🏫 Additional Support
To further your understanding of the Ardens Manager platform:
Book training for your GP Practice, PCN or ICB.
Complete the Risk Stratification & Population Segmentation Academy module.
Explore the Ardens Clinical resources to support the management of Continuity of Care - EMIS practices / SystmOne practices.
Contact our Support Team for support in real time.