
ℹ️ Introduction
This article explains how to use the Population Dashboard in Ardens Manager to monitor patient movements and review capitation-related trends. By the end of this article, you will be able to monitor patient movement activity, understand changes affecting practice population trends, review capitation-related changes, and use trend analysis to support planning and capacity reviews.
Background
Capitation is the funding model used in general practice where practices receive funding based on the number of registered patients. Changes in practice population can therefore affect workload, demand and income.
Monitoring patient movements can help practices to:
Understand whether the practice population is growing or reducing
Identify trends in registrations and deductions
Review demand and workforce capacity
Support service planning and resource allocation
This article forms part of the wider Population Dashboard guidance and focuses specifically on tracking patient movements and capitation trends.
How Ardens Can Help
Within the Population Dashboard, Ardens Manager provides reporting designed to help practices monitor changes in their registered population.
This includes:
Reporting for registrations, deductions, births and deaths
Trend analysis over time
Demographic breakdowns
Filtering and drilldown functionality
Visual reporting to support workforce and demand planning
This allows organisations to better understand how population changes may impact workload, appointments and future planning.
✅Included in Ardens Manager National Content package: Interested in finding out more or requesting a trial? Contact accounts@ardens.org.uk
📍Access the Dashboard
Login to Ardens Manager.
Select Services from the left-hand panel.
Select Population.
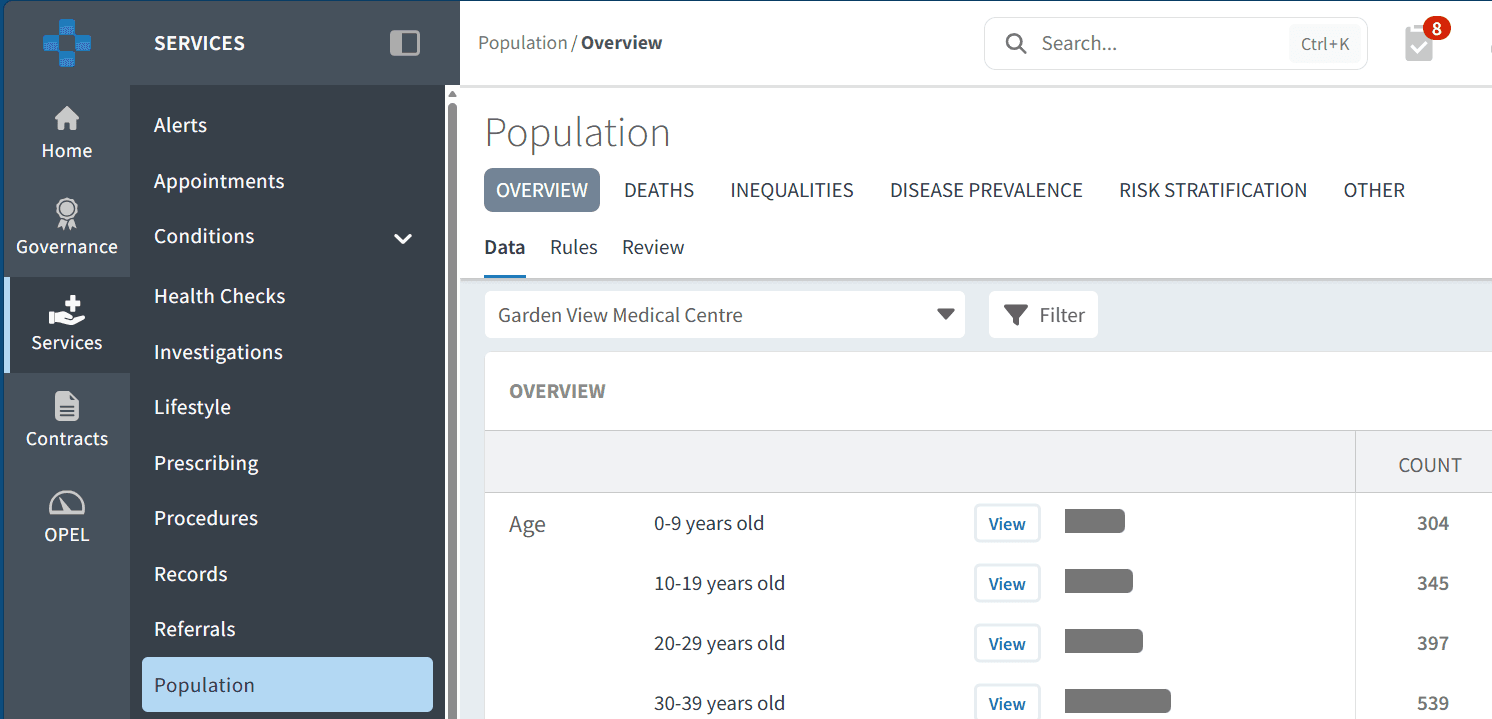
🔎 Monitor Capitation Trends
Review Capitation Activity
To monitor capitation-related activity:
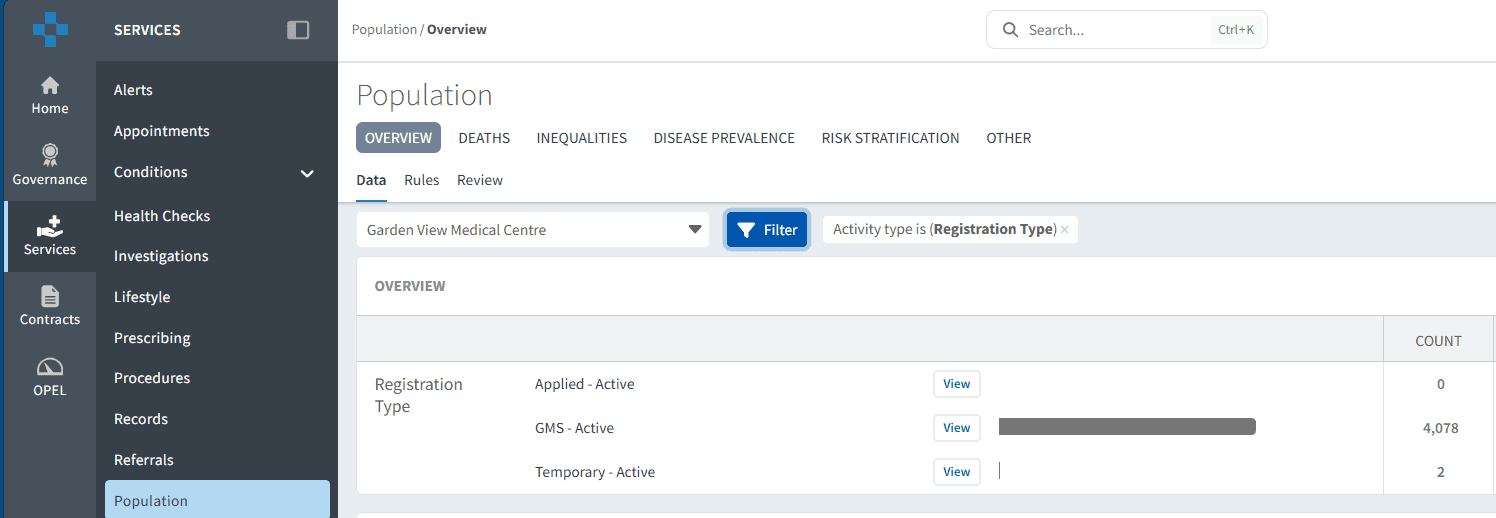
Open the Overview tab
Scroll to the Registration Type section
Review the number of patients by registration category
Compare activity against previous periods where required
You can also use the filter icon to filter by Registration Type activity.
This section allows you to:
View current registration activity
Compare monthly changes
Identify increases or reductions in practice population
Monitor trends over time
To analyse trends in more detail:
Click View next to the relevant report
Open the Trend chart
Adjust the date range using the date picker if required
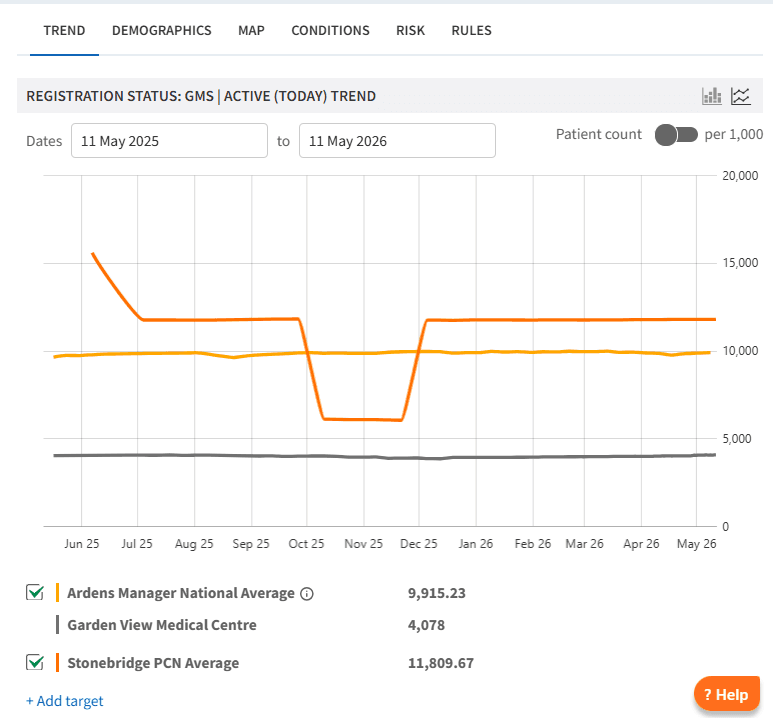
The trend view helps visualise changes in patient registrations over time and can support workforce and capacity planning.
Monitor Patient Movements
To review patient movement activity:
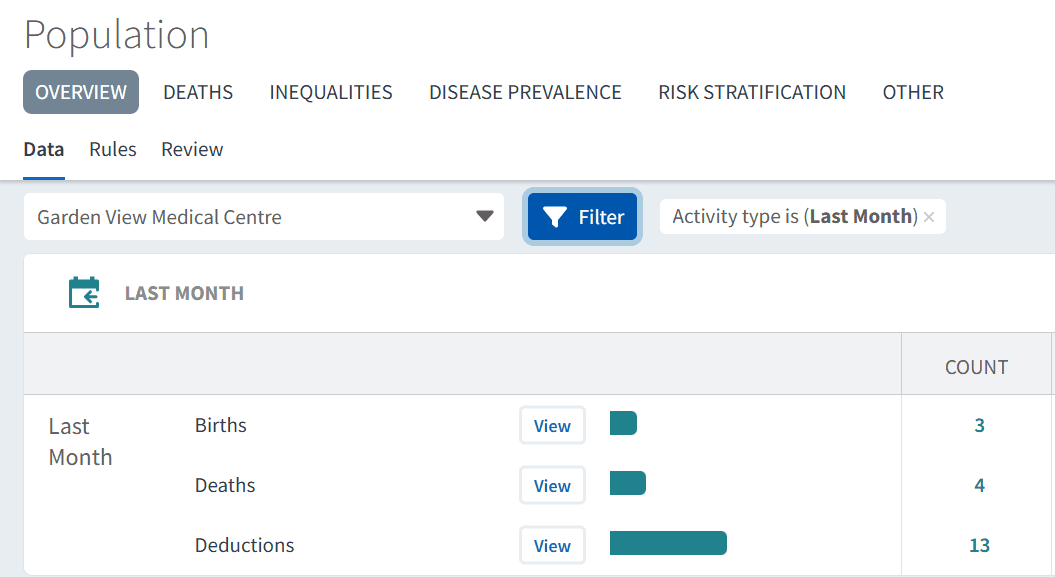
Scroll to the Last Month section
Review activity for:
New registrations
Deductions
Births
Deaths
Alternatively, use the filter icon and select Last Month as the activity type.
To investigate trends further:
Click View next to the relevant report
Open the Trend tab
Use the Demographics tab to analyse population changes in more detail
Use the Map to visualise the geographical spread across your area
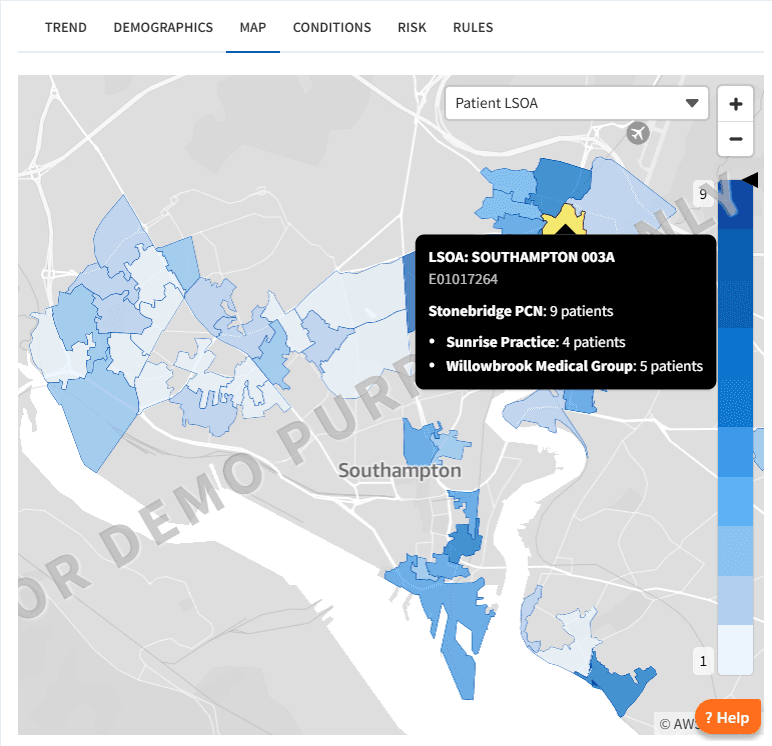
This can help practices identify whether demand is changing within specific patient groups or demographics.
📊 Using Data for Planning
Patient movement trends can help practices understand whether demand is increasing, stable or reducing over time.
Examples of how practices may use this information include:
Reviewing appointment capacity against population growth
Identifying increasing demand in specific age groups
Supporting workforce and recruitment planning
Understanding future Long Term Condition review workload
Comparing patient movement trends alongside appointment or QOF activity
Trend analysis can also help identify unexpected changes in registrations or deductions which may require further investigation.
❓ FAQs
Can I view historical trends?
Yes. Trend charts allow you to review historical data using custom date ranges.
Can I analyse specific patient groups?
Yes. The dashboard includes demographic, condition and risk analysis to help review trends across different patient populations.
🏫 Additional Support
To further your understanding of the Ardens Manager platform:
Book training for your GP Practice, PCN or ICB.
Contact our Support Team for support in real time.