
ℹ️ Introduction
This article explains how to use Ardens Manager to monitor and review procedure activity across your organisation. By the end, you will be able to track procedures and use the dashboard to support performance and workload planning.
Background
Monitoring procedures are essential for ensuring safe, timely, and effective patient care. Practices need visibility of procedure volumes, trends, and key performance indicators to support service delivery, identify gaps, and meet clinical targets (e.g. cervical screening uptake).
How Ardens Can Help
Ardens Manager provides a Procedures Dashboard that allows practices to:
Monitor procedure activity by type
Track trends and volumes over time
Support workload planning and service evaluation
✅Included in Ardens Manager National Content package: Interested in finding out more or requesting a trial? Contact accounts@ardens.org.uk
📍Accessing the Dashboard
Log into Ardens Manager.
Select the Services module from the left sidebar.
Open the Procedures dashboard.
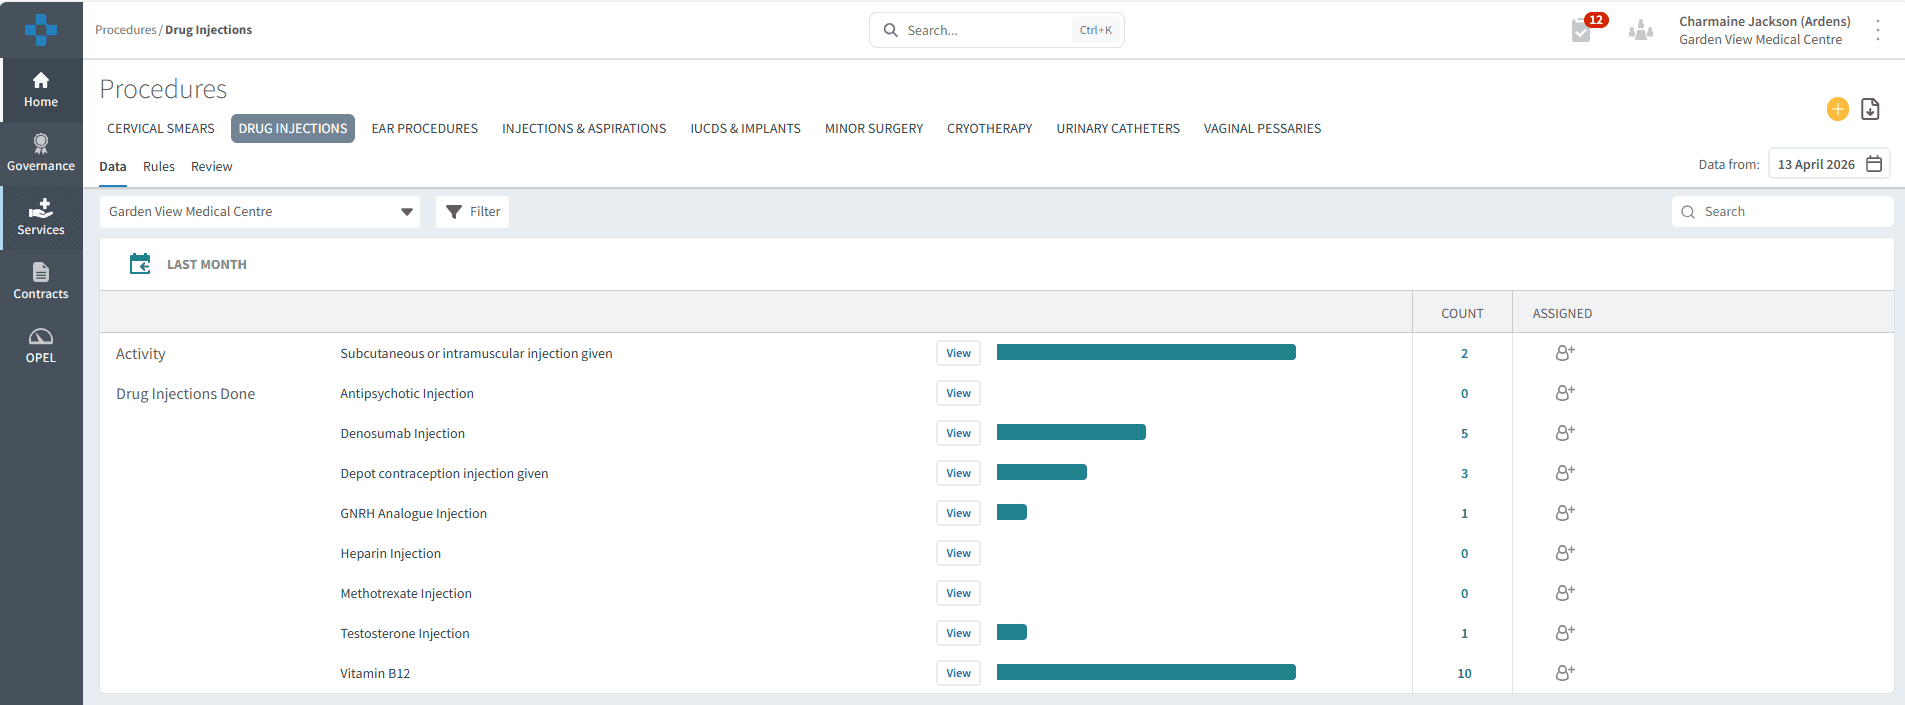
🔎 Review Data
The dashboard is filtered by tabs based on the procedure type, allowing you to quickly navigate and review specific areas of activity.
Cervical Smears
Drug Injections
Ear Procedures
Injections & Aspirations
IUCDs & Implants
Minor Surgery
Cryotherapy
Urinary Catheters
Vaginal Pessaries
Each tab provides an overview of activity, helping you understand patterns, monitor demand, and support high-level reporting and decision-making.
📆 Last Month Activity
This section provides a summary of procedures completed in the last month, allowing you to quickly review recent activity and identify trends or changes in demand.
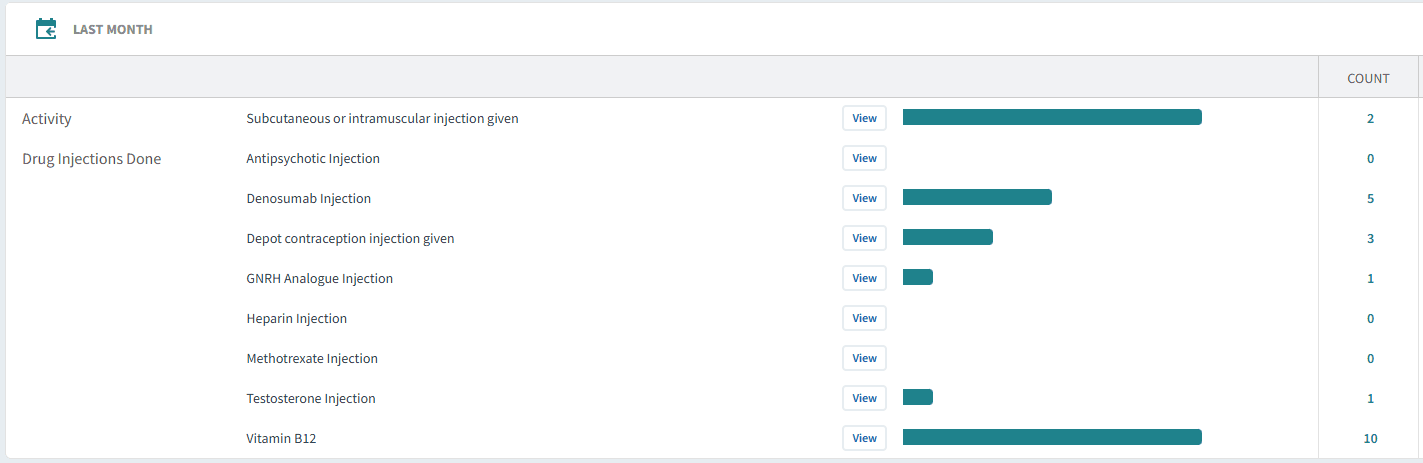
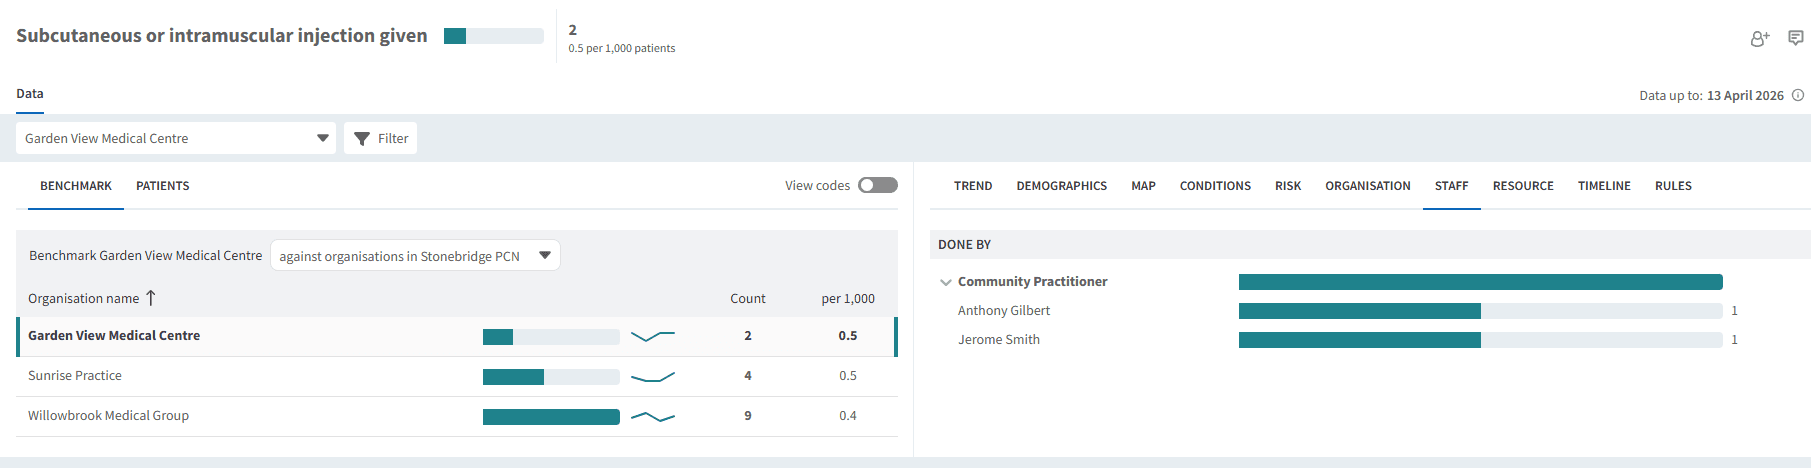
Select the View button next to the report to explore the data in more detail. From here, you can break it down by patient demographics, trends, and staff category, helping you understand the volume of procedures carried out by different staff members.
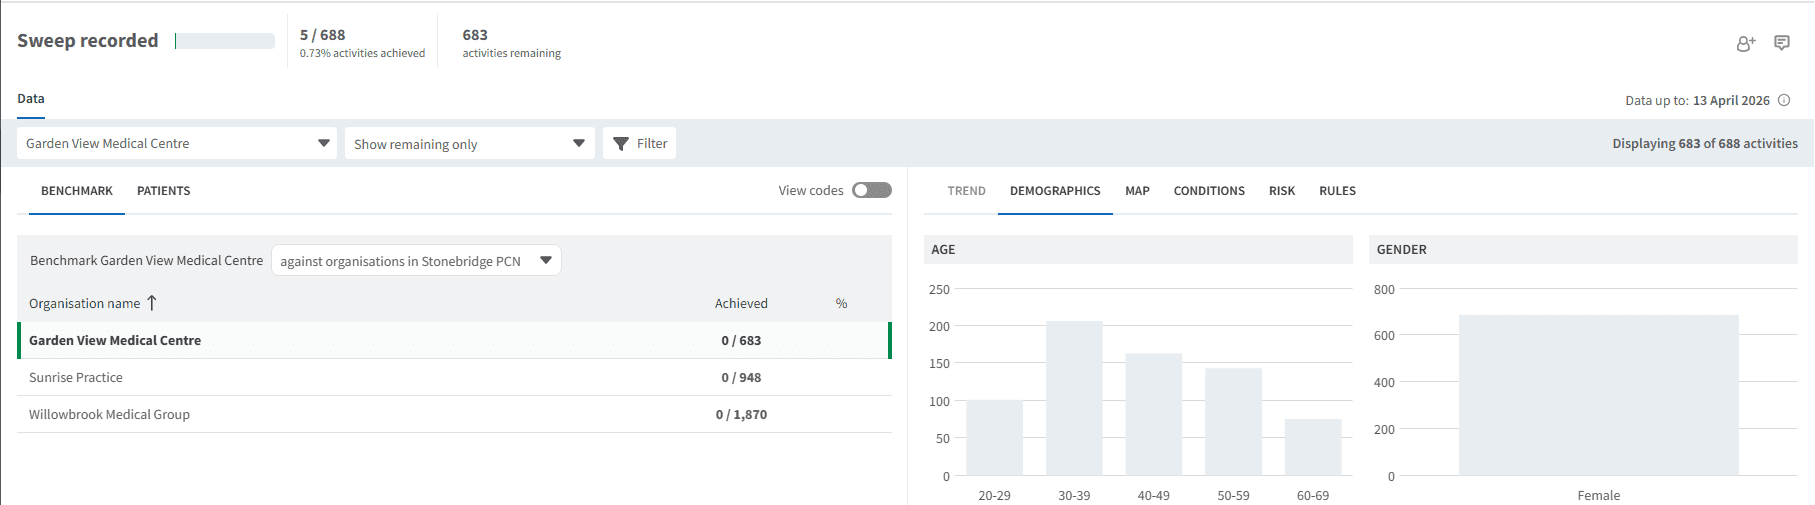
📊 Performance Indicators
This section highlights key performance indicators for each procedure type, supporting quality improvement and ensuring targets are being met (e.g. screening uptake, procedure frequency).
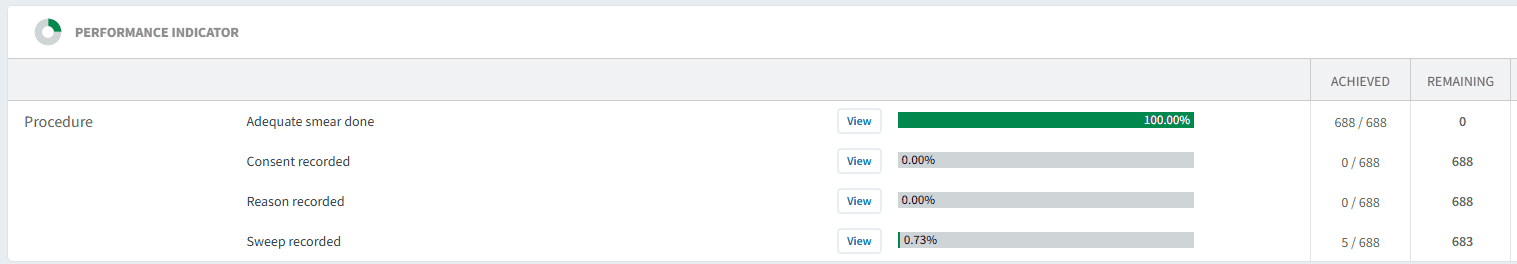
Select the View button next to the report, then apply the Show remaining only filter to identify work that is still outstanding. Use the PATIENTS tab to view and identify the patients included in this list.
❓ FAQs
What time period does the dashboard cover?
The dashboard primarily highlights activity from the last month, with options to explore trends in more detail.
Can I view detailed patient-level data?
Yes, by selecting the View button you can access the Single Report screen and review patient-level information within the PATIENTS tab.
🏫 Additional Support
To further your understanding of the Ardens Manager platform:
Book training for your GP Practice, PCN or ICB.
Contact our Support Team for support in real time.