
ℹ️ Introduction
This article explains how to use Ardens Manager to monitor Did Not Attend (DNA) rates. By the end of this article, you will be able to identify patterns in missed appointments and take action to improve utilisation of available capacity.
Background
DNA rates represent appointments where patients do not attend and can significantly impact service efficiency.
High DNA rates may:
Reduce available capacity
Increase waiting times
Contribute to unmet demand
Affect patient outcomes
Understanding when and why DNAs occur is key to reducing missed appointments.
How Ardens Can Help
Ardens Manager provides detailed reporting on DNA activity within the Appointments Dashboard, allowing you to monitor trends, identify patterns, and understand the impact of missed appointments across your organisation.
The dashboard allows you to:
Monitor rates over time
Identify patterns by patient group, demographics, and risk
Analyse variation by appointment type and staff group
Identify patients with repeated DNAs
Assess the impact on workforce capacity
This supports a more targeted approach to reducing DNAs and improving utilisation of available appointments.
✅Included in Ardens Manager National Content package: Interested in finding out more or requesting a trial? Contact accounts@ardens.org.uk
📍 Access DNA Reports
Login to Ardens Manager
Select Services from the left-hand panel
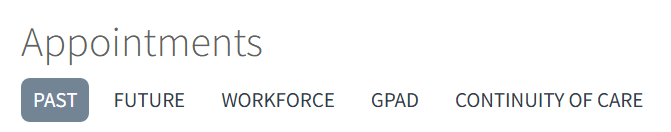
Select the Appointments dashboard
Click on the Past tab
📊 Monitor DNA Rates
DNA reports can be analysed either on a monthly basis or over a rolling 12-month period.
Use these reports to:
Track total number of DNAs
Monitor DNA rates over time
Identify increases or reductions in missed appointments
Identify Patterns in DNA Activity
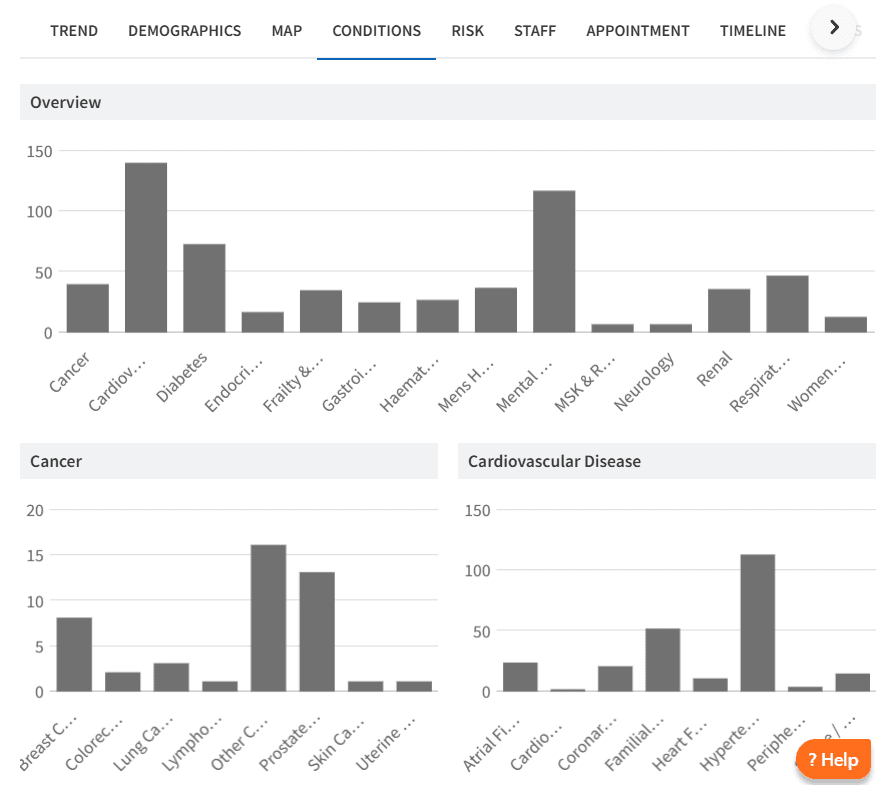
To identify patterns, use the available breakdown options to understand which patients are more likely to DNA. You can also use the map view to explore any geographic variation.
Use this to:
Identify trends linked to specific conditions
Analyse DNAs by risk category
Review trends by patient demographics
This helps identify where targeted interventions may be required.
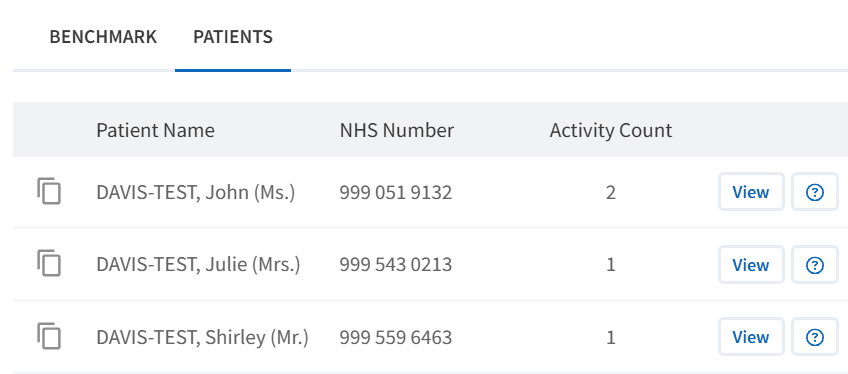
Target High-Rate Patients
The PATIENTS tab highlights how many appointments each patient has missed over the selected time period.
Use this to:
Identify patients with repeated DNAs
Target communication or additional support
Review whether alternative appointment approaches are required
Assess Impact
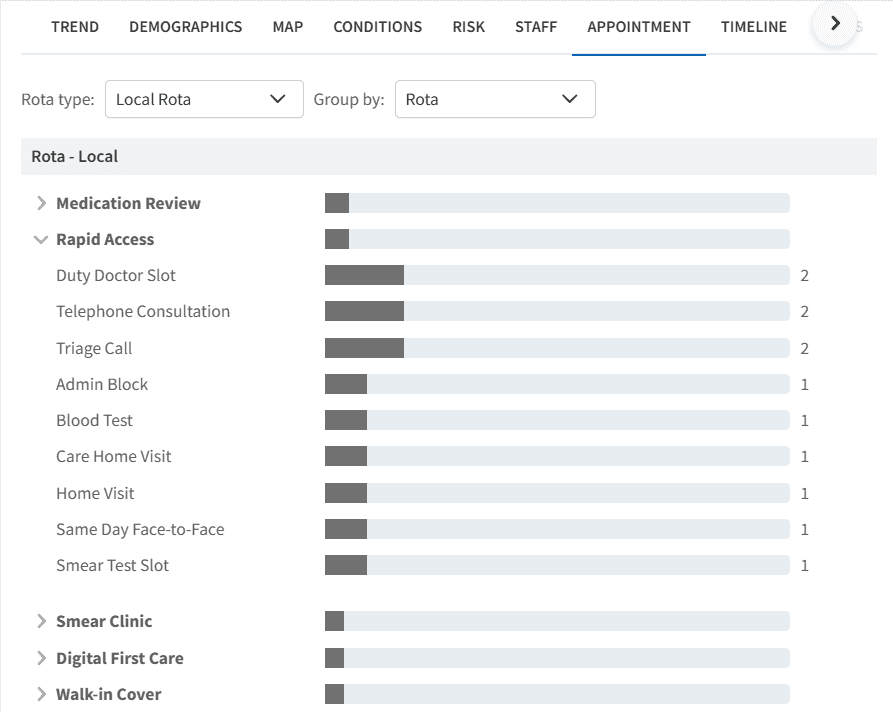
DNA rates can also be analysed by workforce and appointment type.
The STAFF tab shows DNA rates by clinician or role group, while the APPOINTMENTS tab highlights which appointment slot types are most frequently missed.
Use this to:
Identify variation in DNA rates by staff group
Analyse which appointment types are more likely to be missed
Review whether appointment structure is contributing to DNAs
Monitor Improvement
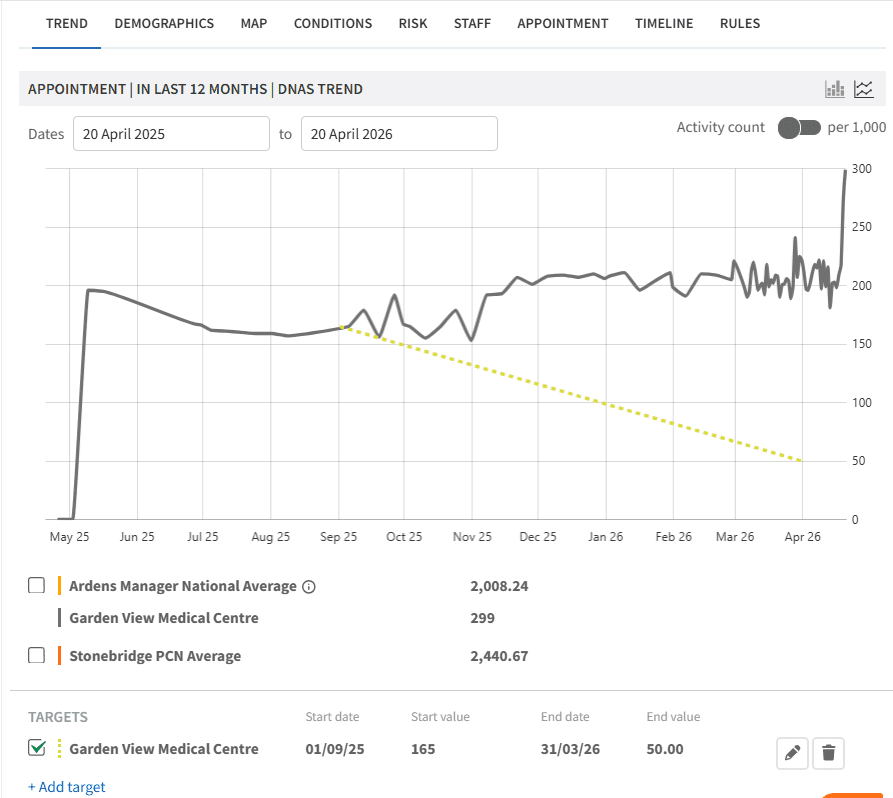
Track changes in DNA rates over time using the TREND chart to evaluate the impact of interventions.
You can also add local targets to measure improvement.
To add a local target:
Select the TREND tab
Click + Add Target
Complete the required fields
Click the save icon
❓ FAQs
Why are DNA rates important?
They reduce available capacity, increase waiting times, and impact overall service efficiency.
How can I identify patients who frequently DNA?
Use the PATIENTS tab to view the number of DNAs per patient and identify those with repeated missed appointments.
What factors contribute to high DNA rates?
Common factors include appointment timing, communication issues, patient demographics, and type of appointment offered.
Can I see which appointment types are most likely to DNA?
Yes, the APPOINTMENTS tab shows DNA rates by slot type, helping identify patterns.
How can I monitor whether interventions are working?
Use the TREND chart to track DNA rates over time and compare against local targets.
🏫 Additional Support
To further your understanding of the Ardens Manager platform:
Book training for your GP Practice, PCN or ICB
Complete the Appointments academy module
Contact our Support Team for support in real time