
ℹ️ Introduction
This article explains how to use Ardens Manager to review Capacity and Access insights across your PCN. By the end of this article, you will be able to understand patient experience, review workforce data, and analyse access to services to support improvement and planning.
Background
Improving access to primary care services is a key priority within the Network Contract Directed Enhanced Service. This includes not only increasing capacity, but also understanding how patients experience access and how services are delivered.
Access is influenced by multiple factors, including:
Patient experience and satisfaction
Workforce capacity and skill mix
Routes into care (e.g. online consultations, pharmacy referrals)
Timeliness of appointments and care delivery
Bringing these elements together provides a more complete picture of how access is working across a PCN.
How Ardens Can Help
Ardens Manager provides a dedicated Capacity & Access section within the Network Contract DES Dashboard, bringing together data from national datasets to support a comprehensive view of access.
This includes:
Patient Experience data from the GP Patient Survey and Friends and Family Test
Workforce data including GP, PCN, and ARRS roles (FTE)
Access channels such as online consultations and community pharmacy referrals
Access performance data including GPAD metrics and waiting times
This combined view allows PCNs to understand access from both a patient and service delivery perspective, moving beyond individual data points to see how workforce, access routes, and patient experience interact to influence overall access.
✅Included in Ardens Manager National Content package: Interested in finding out more or requesting a trial? Contact accounts@ardens.org.uk
📍How to Access
Login to Ardens Manager
Select Contracts from the left-hand panel
Select Network Contract DES ‘26-27
Navigate to the Capacity & Access section
📊 Monitor Capacity & Access
The dashboard provides a high-level overview of access across your PCN, bringing together patient experience, workforce, and access performance data.
This supports a clearer understanding of how access is experienced and delivered across the network.
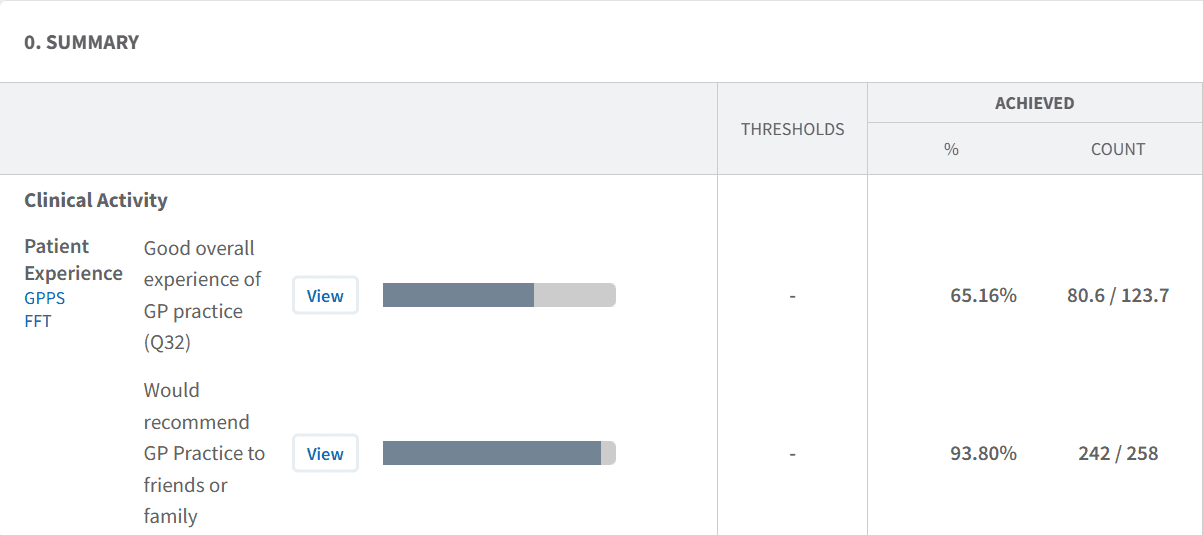
Review Patient Experience
The dashboard includes patient experience data from sources such as the GP Patient Survey and Friends and Family Test.
Use this section to:
Understand how patients rate their experience of accessing care
Review feedback on contacting the practice (e.g. phone access)
Assess how easy patients find using online services
Identify areas where patient experience may be lower
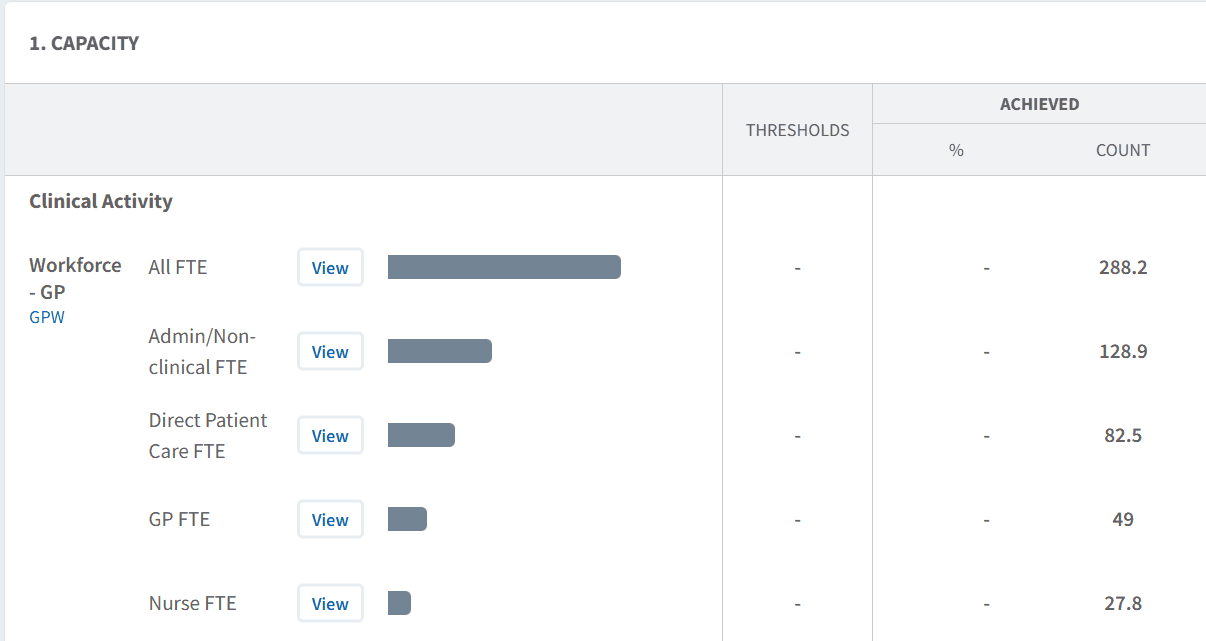
Review Workforce Capacity
The dashboard includes workforce data from national datasets, including:
GP workforce
PCN workforce
Additional Roles Reimbursement Scheme (ARRS) roles
Use this section to:
Understand workforce FTE levels across the PCN and individual practices
Review the skill mix of the workforce
Identify variation between practices
Support workforce planning and development
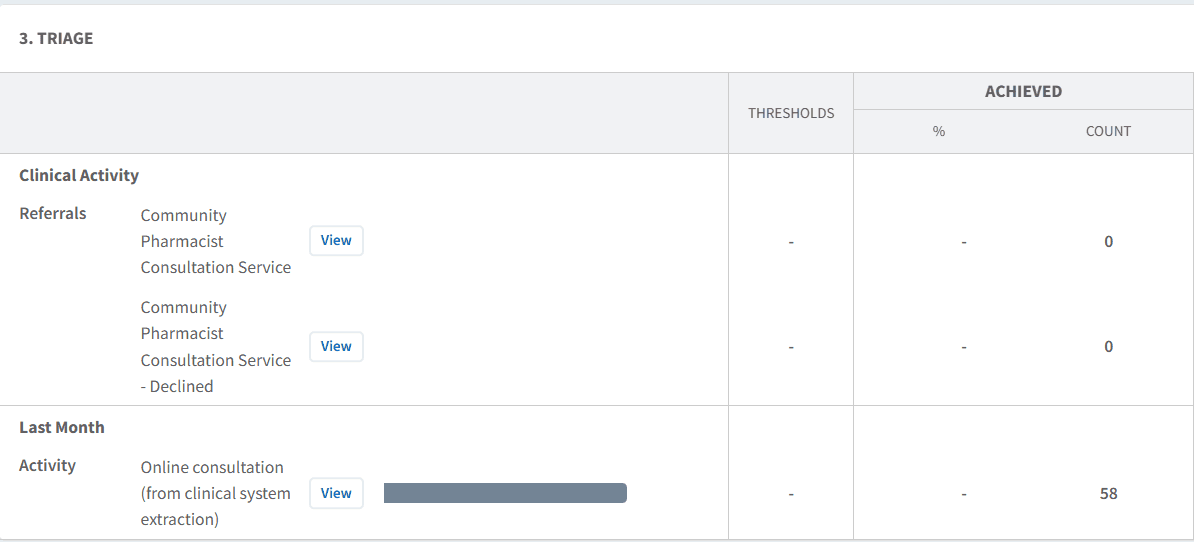
Understand Access Channels
Access to care is influenced by how patients enter the system.
Use this section to:
Review activity via online consultations
Understand usage of community pharmacy referrals and triage pathways
Monitor how different access routes are being used
Identify opportunities to optimise digital and alternative pathways
This helps ensure patients are accessing the most appropriate services.
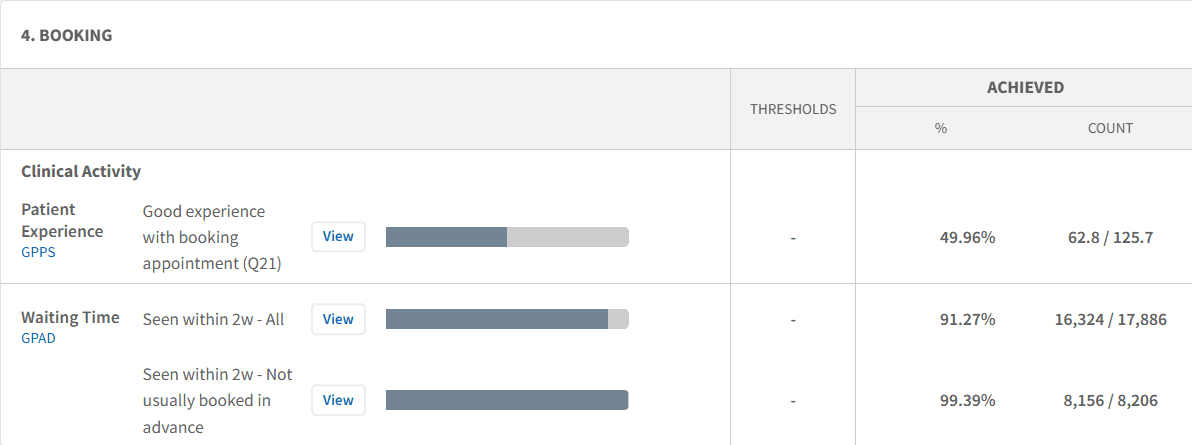
Monitor Access & Waiting Times
The dashboard includes access performance data such as GPAD metrics and waiting times.
Use this to:
Review how quickly patients are being seen
Monitor appointments completed within 2 weeks of booking
Identify patients not seen within expected timeframes
Track trends in timeliness of care
This provides insight into how effectively access is being delivered.
Identify Variation
Variation in experience, workforce, and access can highlight areas for improvement.
Use this to:
Compare patient experience across practices
Identify differences in workforce capacity
Review variation in access routes and waiting times
Support targeted improvement and shared learning
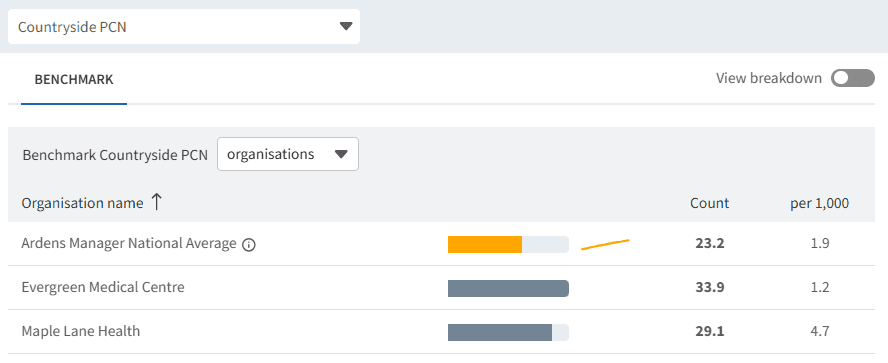
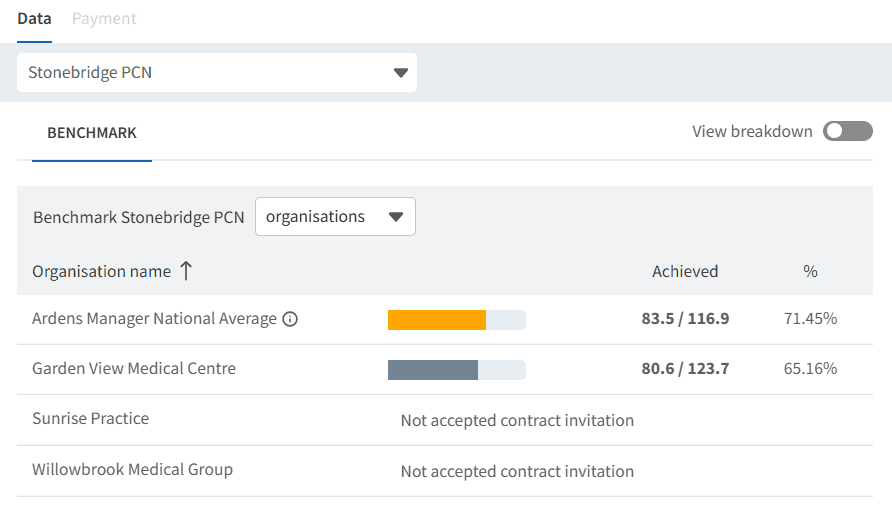
To access the BENCHMARK table:
Click View next to the relevant report
Select the BENCHMARK tab
Click on a practice to isolate their data.
🔎 Report Breakdown
From the main dashboard view, reports display a headline figure (for example, overall patient experience or total workforce FTE per category). To understand the detail behind these figures, you can view the full breakdown of each report.
To access this:
Click View next to the relevant report
Select the View Breakdown toggle
This will display the underlying data behind the headline measure. For example:
Patient Experience → view how responses are distributed (e.g. very good, fairly good, poor)
Workforce → view breakdown by role type (e.g. partner, salaried GP, locum)
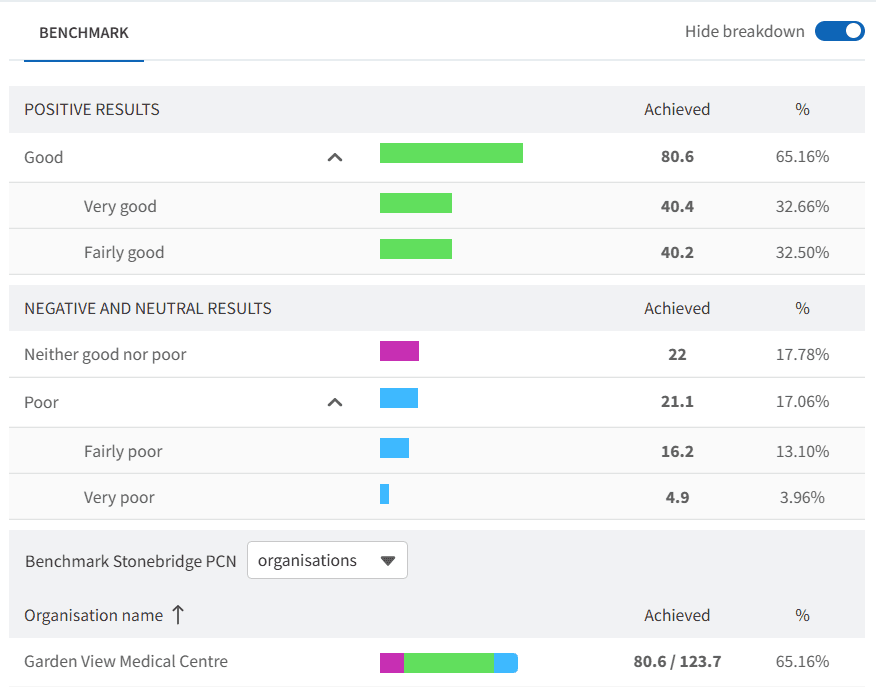
The TREND chart will also display how this data changes over time.
Use this to:
Understand what is driving the overall figure
Identify patterns and trends
Gain more detailed insight to support decision-making
❓ FAQs
What data is included in Capacity & Access?
It includes patient experience data, workforce data, access channel activity, and performance metrics such as waiting times.
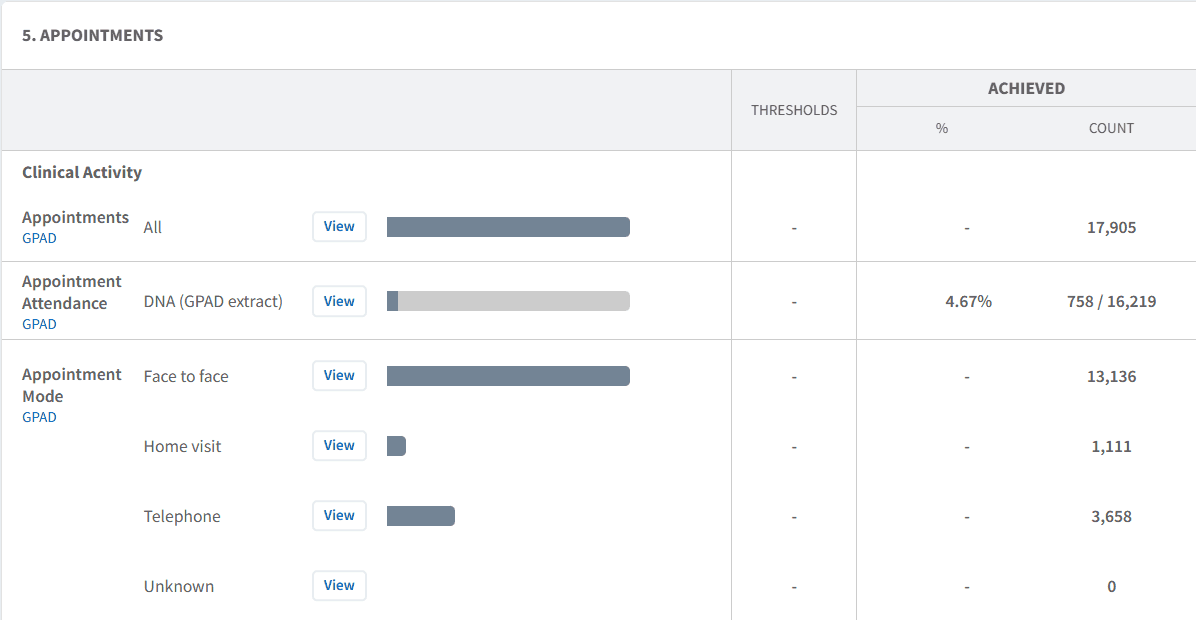
Does this include appointment data?
It includes high-level access and timeliness data (e.g. GPAD), rather than detailed appointment-level scheduling.
Can I compare practices within my PCN?
Yes, data can be viewed at practice level to understand variation across the network.
How can this data be used?
It can support service improvement, workforce planning, and access-focused decision-making.
🏫 Additional Support
To further your understanding of the Ardens Manager platform:
Book training for your GP Practice, PCN or ICB
Complete the Network Contract DES academy module
Contact our Support Team for support in real time