
ℹ️ Introduction
This article explains how to use the Ardens Manager Renal dashboards to understand prevalence, monitor activity, evaluate quality of care and identify data quality issues across Chronic Kidney Disease (CKD). By the end of this guide, you will be able to use these insights to support proactive planning, structured reviews and quality improvement across your practice, PCN or ICB.
Background
Chronic Kidney Disease is a long‑term condition associated with increased cardiovascular risk, multimorbidity and health inequality. Effective CKD management relies on accurate diagnosis, correct staging, regular monitoring and timely intervention to slow progression and reduce complications.
For GP practices, PCNs and ICBs, it is important to:
Understand local CKD prevalence and stage distribution.
Ensure accurate diagnosis and staging using eGFR and ACR.
Monitor review activity and care delivery.
Identify patients with potential missed or uncertain CKD diagnosis.
Reduce unwarranted variation in diagnosis, monitoring and follow‑up.
The Ardens Manager Renal dashboards provide population‑level oversight to support consistent, high‑quality CKD care.
How Ardens Can Help
The Ardens Manager Renal dashboard focuses on Chronic Kidney Disease, bringing together insight to support:
Prevalence and population analysis.
CKD staging and monitoring.
Review of activity and service delivery.
Identification of missed or incomplete diagnosis.
Evaluation of quality and safety of care.
The dashboard works alongside existing Ardens Clinical resources in EMIS and SystmOne to support structured CKD reviews and accurate coding. To learn more about the clinical resources, access the support articles below:
✅Included in Ardens Manager National Content package: Interested in finding out more or requesting a trial? Contact accounts@ardens.org.uk
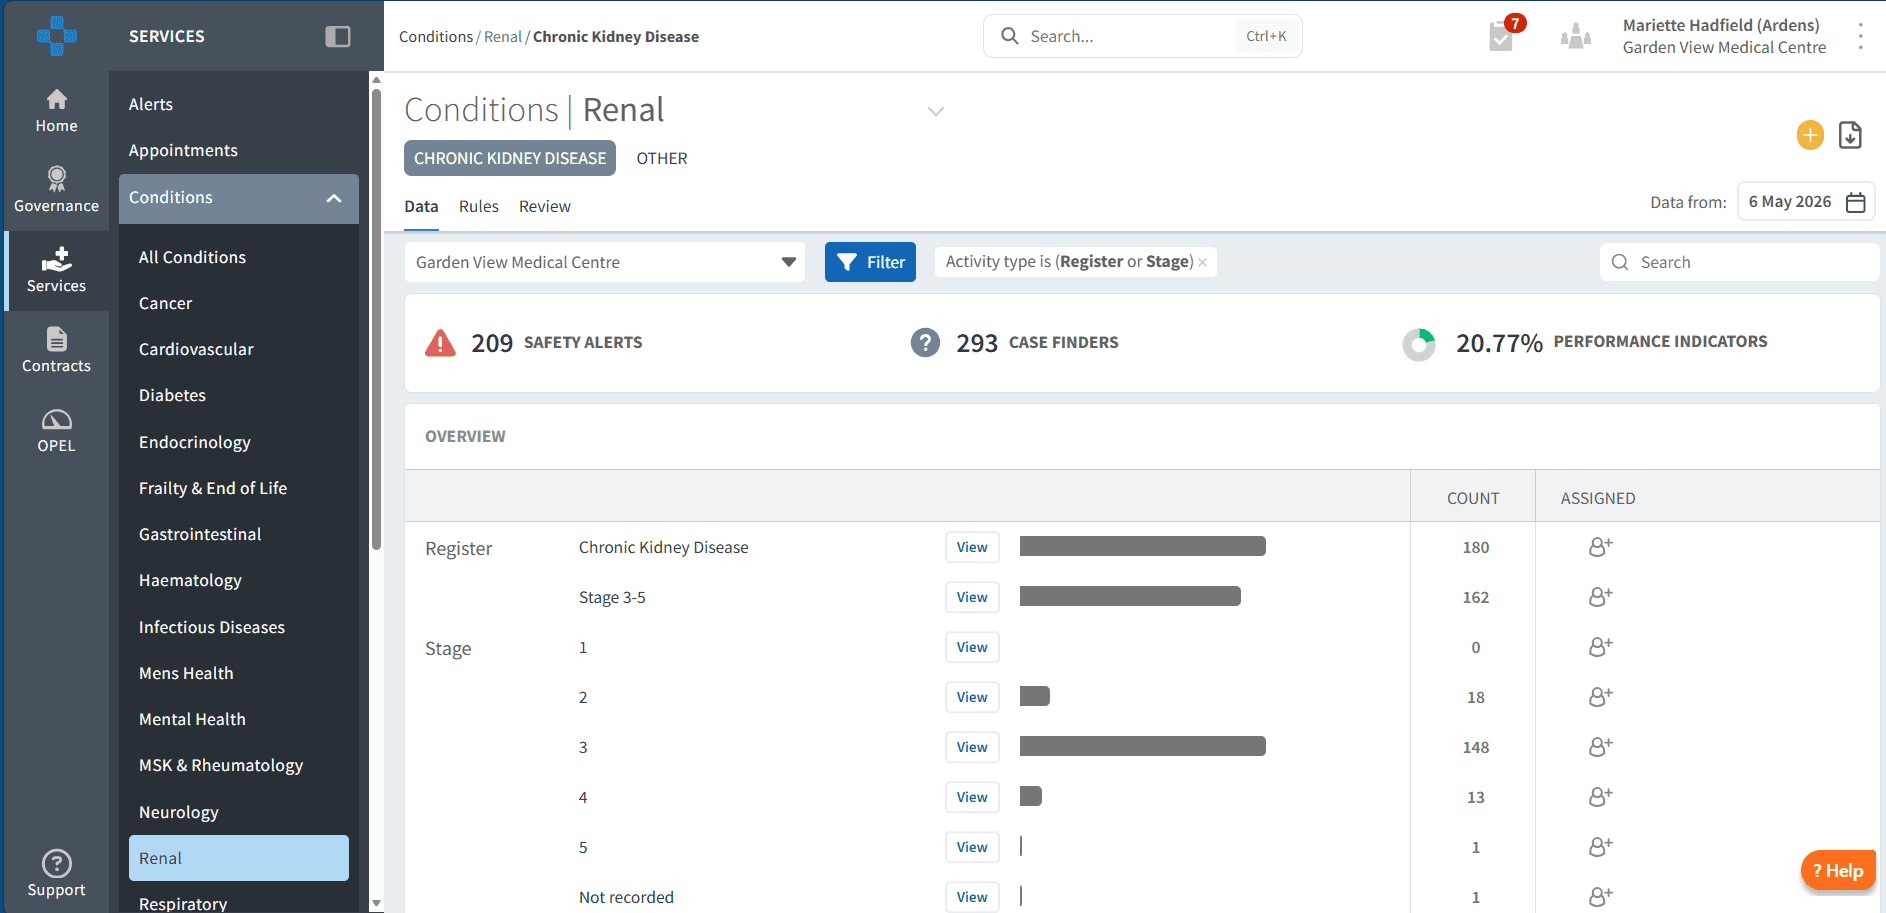
📍 Access the Dashboard
Log into Ardens Manager.
Go to Services on the left-hand pane.
Open to Conditions folder.
Click on Renal.
Click on the required condition tab.
📊 Plan & Forecast Demand
The Overview section enables organisations to analyse coded registers, identify population trends, and plan workforce and review activity accordingly.
Understand Your Population
The registers provide visibility of patients coded with a Chronic Kidney Disease or other renal conditions, supporting understanding of:
Recorded prevalence
CKD stage distribution.
Population demographics.
Coding patterns and register accuracy.
Size of the cohort requiring monitoring or follow‑up.
This insight supports informed planning and prioritisation of review activity.
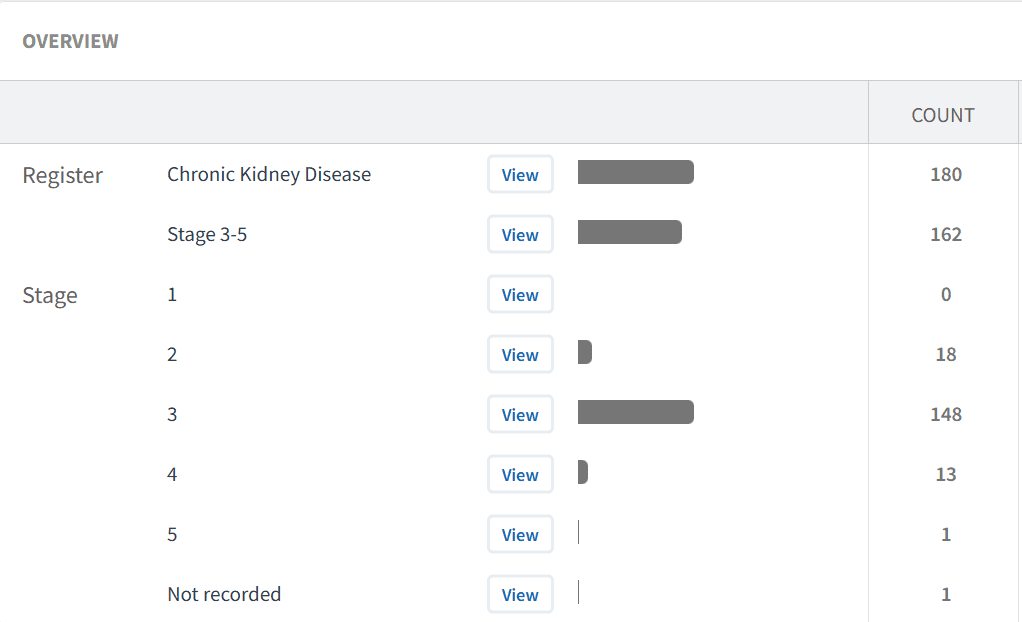
To review registers:
Click the View button next to the relevant register report.
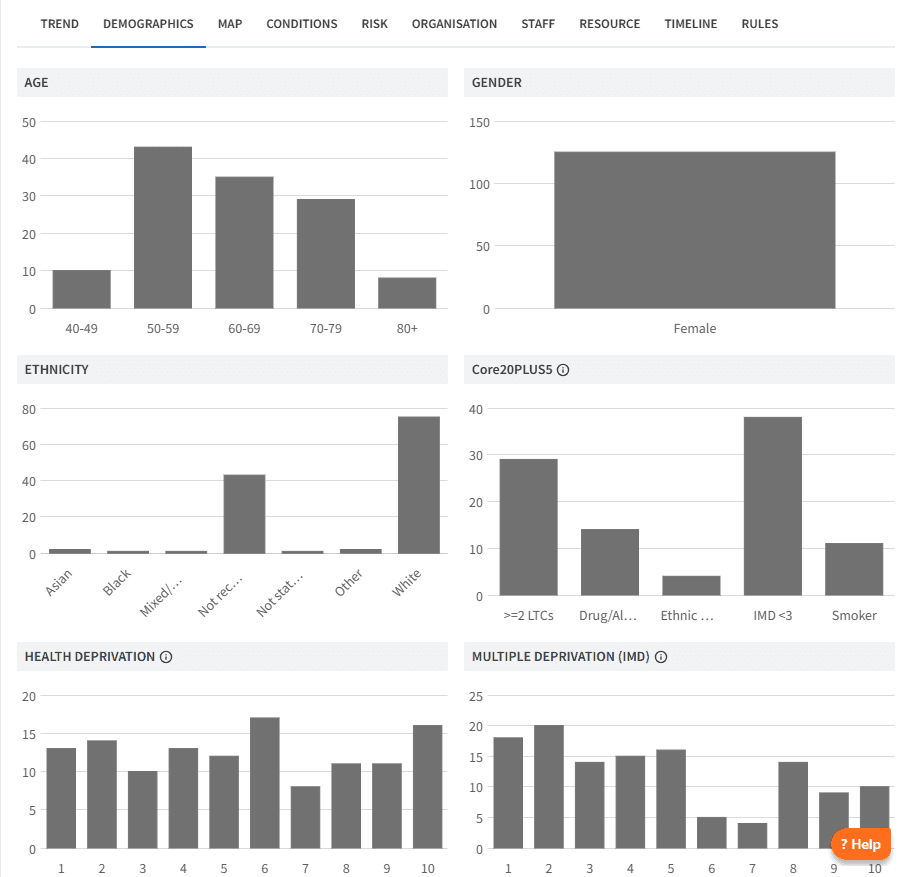
Review the Demographic tab to understand age distribution and deprivation.
Review the Conditions tab to explore multimorbidity.
Review the Risk tab to identify patients in vulnerable or higher-risk groups.
Further insights allow organisations to review diagnosis patterns by clinician and by patient geography, supporting identification of variation and unmet need.
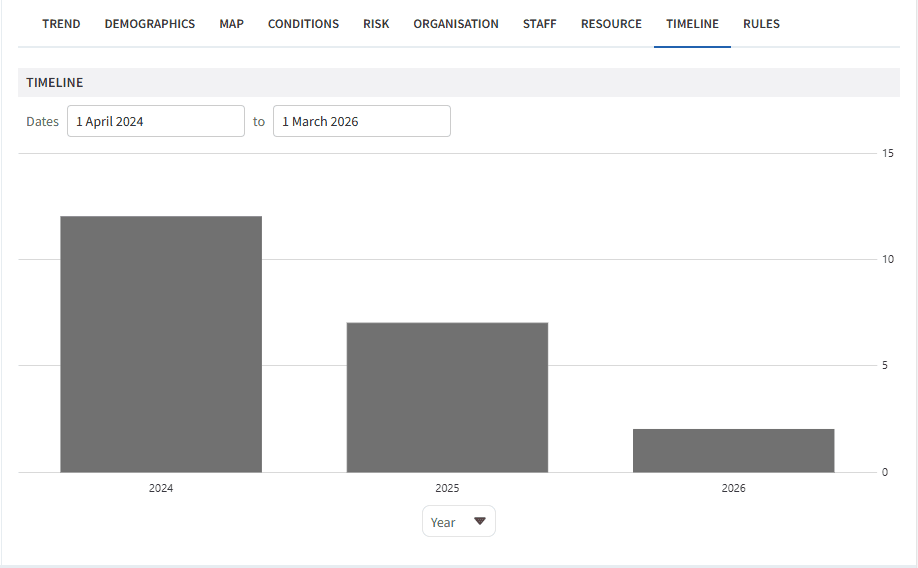
Analyse Trends
Understanding how CKD registers change over time supports monitoring of disease burden and workload.
To analyse trends:
Click View next to the required report.
Click on the Timeline tab.
Choose Year (or another timeframe) from the drop down below the chart
This allows you to:
Monitor changes in CKD prevalence.
Identify shifts in stage distribution.
Inform future capacity and service planning.
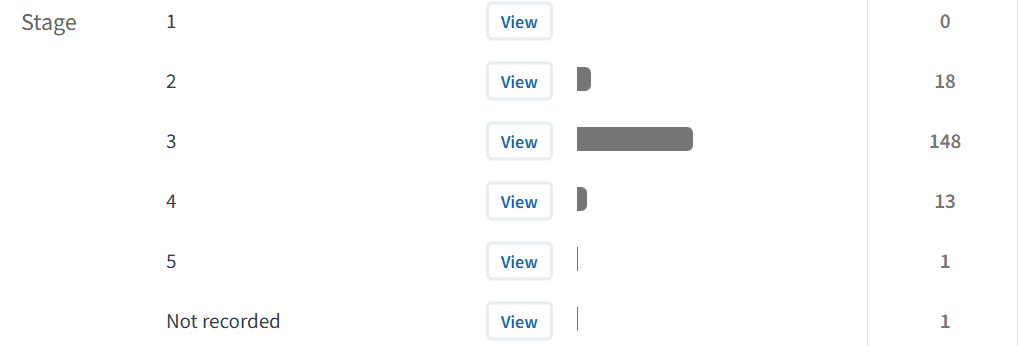
CKS Staging
Within the Renal dashboard, CKD staging can be used as a form of stratification, enabling teams to:
Identify patients with more advanced CKD.
Prioritise follow‑up and monitoring.
Focus resources on patients at higher risk of progression or complications.
This allows structured oversight without a separate risk stratification module.
🔎 Monitor Activity & Quality
The dashboards provide tools to support clinical governance, patient safety and service oversight.
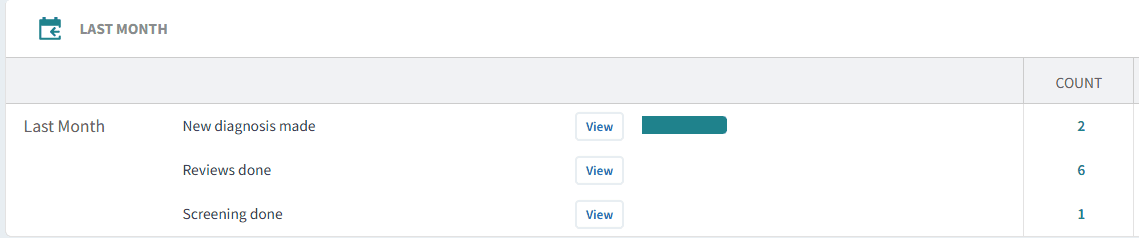
Last Month Activity
All diabetes dashboards include a summary of activity for the previous month, including:
New CKD diagnoses recorded.
Reviews or monitoring activity completed.
Workforce involvement by role.
To review activity:
Click View next to the activity report.
Review the Demographic, Conditions, Risk and Staff tabs.
Analyse the Timeline tab to understand recent trends.
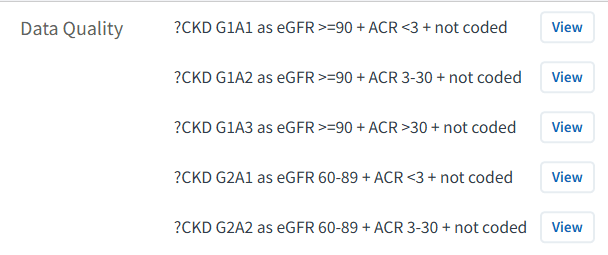
Data Quality
The Renal dashboard includes a dedicated Data Quality section to help identify patients who may have CKD based on clinical results but are not yet coded appropriately. Examples include:
eGFR ≥90 with ACR <3 but a suspected CKD code.
Biochemical evidence of CKD without a formal diagnosis.
Incomplete or inconsistent staging codes.
These reports support:
Improved diagnostic accuracy.
Correct inclusion or removal from CKD registers.
Appropriate follow‑up and monitoring.
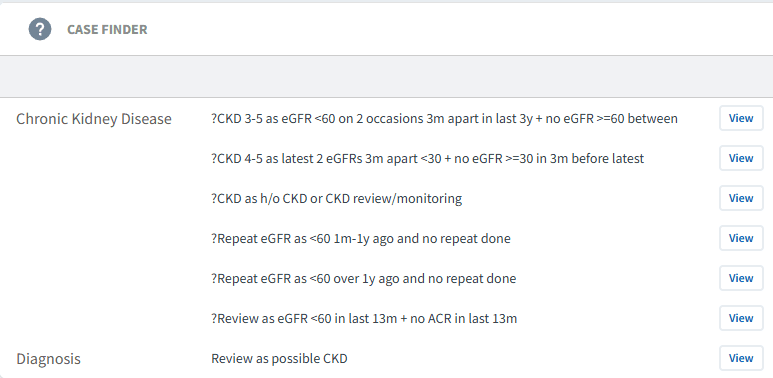
Case Finders
Case Finder reports identify patients who may have CKD but lack an appropriate diagnosis code, often due to missed or inconsistent coding.
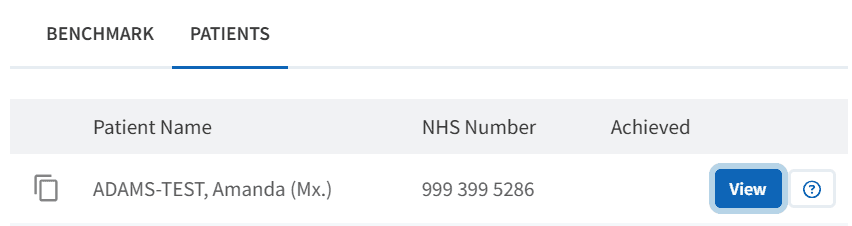
Using case finders:
Click View.
Select PATIENTS tab.
Review each patient record.
If diagnosis is confirmed:
Add the appropriate diagnosis code in the clinical system.
This will move the patient onto the register and remove them from the case finder.
If inclusion is due to a data error:
Amend or remove the incorrect coding in the clinical system.
Performance Indicators
Performance Indicators monitor completion of key CKD care components, supporting quality improvement and structured review delivery. These may include:
CKD diagnosis and staging completeness.
Monitoring requirements (e.g. blood tests).
Annual or structured reviews.
Target achievement where applicable.
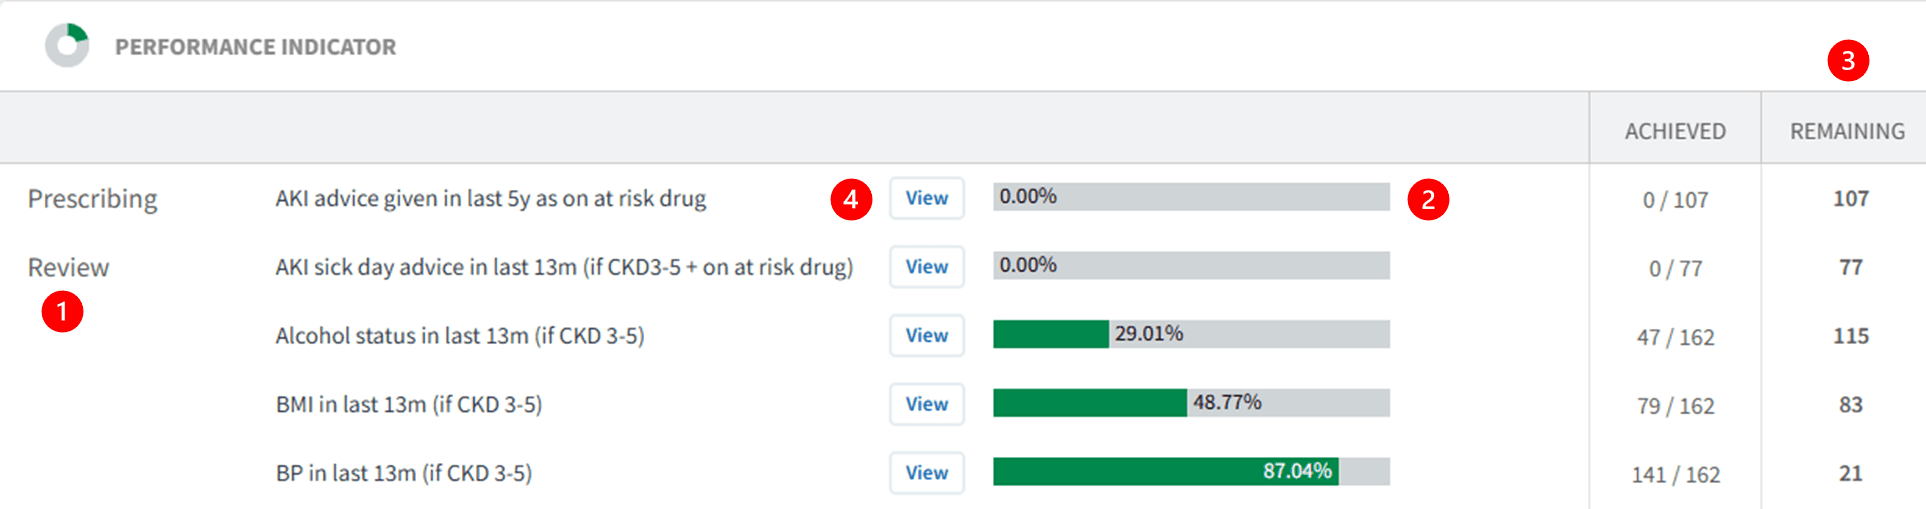
Reviewing performance indicators:
Indicators are grouped by diagnosis, review, target or screening.
Green bars display percentage completion.
The Remaining column highlights outstanding care.
Click View and select Show remaining only to support follow‑up.
⚠️ Please note: Patient data can be exported. Refer to this support article for further information.
Patient View for Follow-up
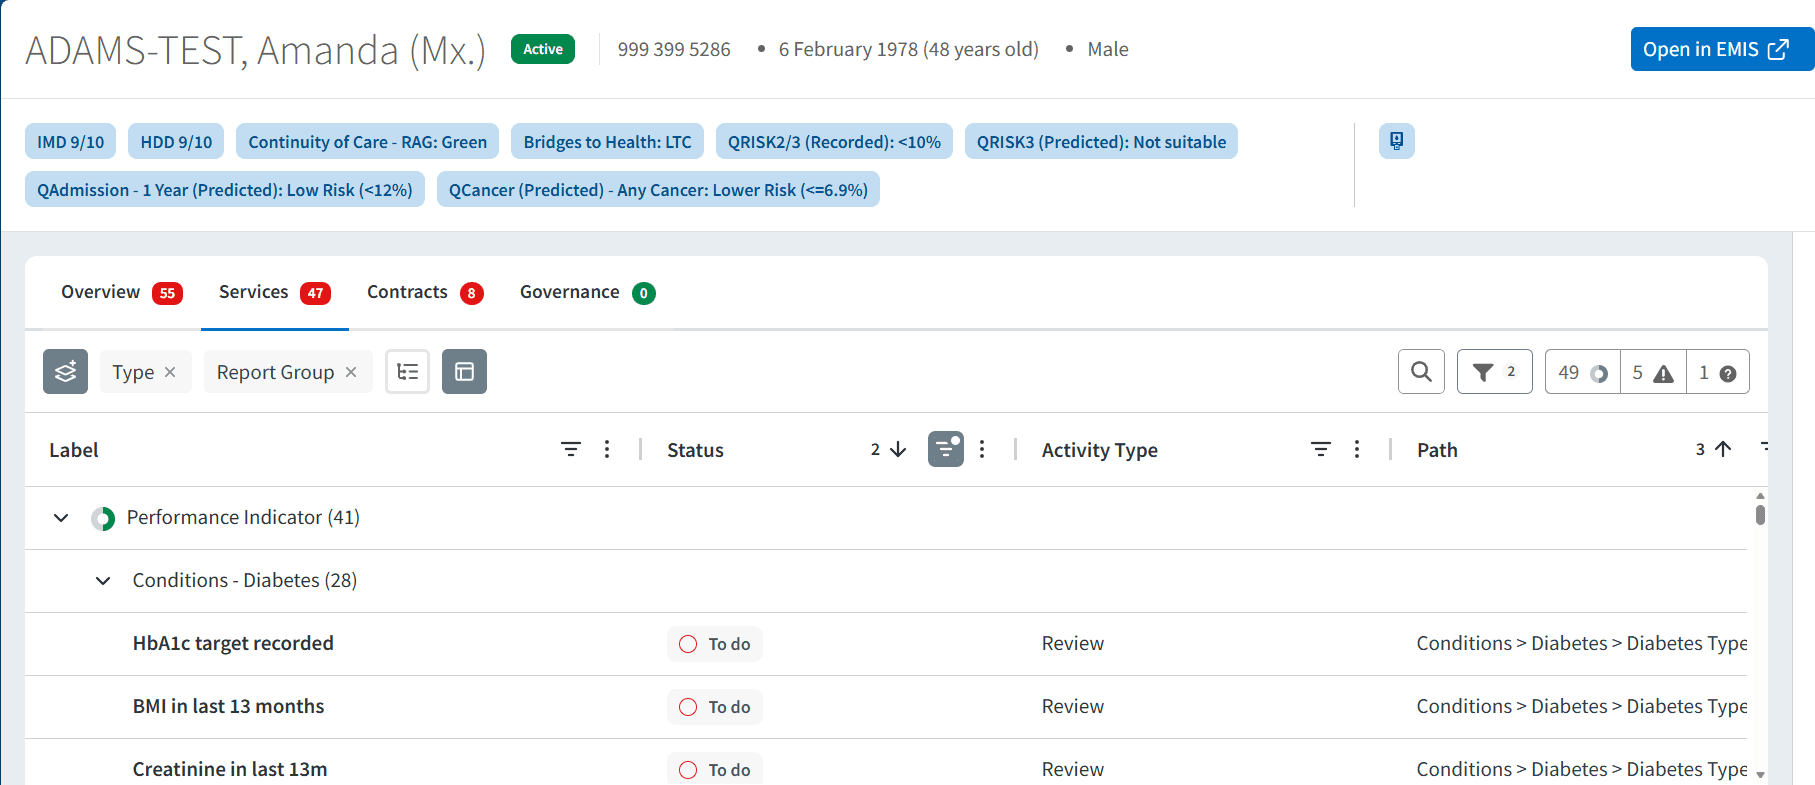
The Patient View functionality enables clinicians and teams to review outstanding elements of care at an individual patient level.
To access Patient View:
Click View next to the patient’s NHS number
Within the patient view:
View all Ardens Manager findings for the patient across relevant reports
Highlight what still needs action
Use this as a prompt list, then review clinical details (history, repeat/long-term use, appropriateness) in the clinical system record
To take action:
Click Open in EMIS/SystmOne to review the full clinical record
Assess suitability of alternatives
Consider patient preference and clinical need
Complete any required medication changes
❓FAQs
What time period does 'Last month activity' refer to?
This reflects activity recorded in the previous calendar month and is updated regularly as data refreshes.
How do case finder reports work?
Case finders identify patients who may meet criteria for diabetes or pre-diabetes but are not coded. These should be clinically reviewed and coded appropriately if confirmed.
How do the dashboards support proactive care?
By highlighting high-risk patients, unmet care needs, and trends, they enable targeted interventions rather than reactive care.
🏫 Additional Support
To further your understanding of the Ardens Manager platform:
Book training for your GP Practice, PCN or ICB.
Contact our Support Team for support in real time.