
ℹ️ Introduction
This article explains how to use the Population Dashboard within Ardens Manager to understand your patient population, monitor trends, and prioritise clinical activity. By the end of this guide, you will be able to navigate the dashboard, review population-level insights, and use the data to support proactive care planning.
Background
Population health management helps practices and PCNs understand the needs of their registered population, identify variation in care, and target interventions more effectively. Reviewing demographic trends, disease prevalence, inequalities, and risk factors can support proactive care delivery and service planning.
How Ardens Can Help
The Population Dashboard within Ardens Manager provides a centralised view of key population data extracted from the clinical system, helping organisations monitor trends and identify patients who may benefit from additional support or review.
Using the dashboard, you can help you to:
Review population demographics and trends
Identify patients requiring additional support or follow-up
Monitor disease prevalence and inequalities
Support proactive care planning and service delivery
Access patient-level cohorts for further action
✅Included in Ardens Manager National Content package: Interested in finding out more or requesting a trial? Contact accounts@ardens.org.uk
📍 Access the Dashboard
Login to Ardens Manager.
Select Services from the left-hand panel.
Select Population.
📈 Identify Trends
The dashboard can be used to understand the overall makeup of your registered population and monitor changes over time.
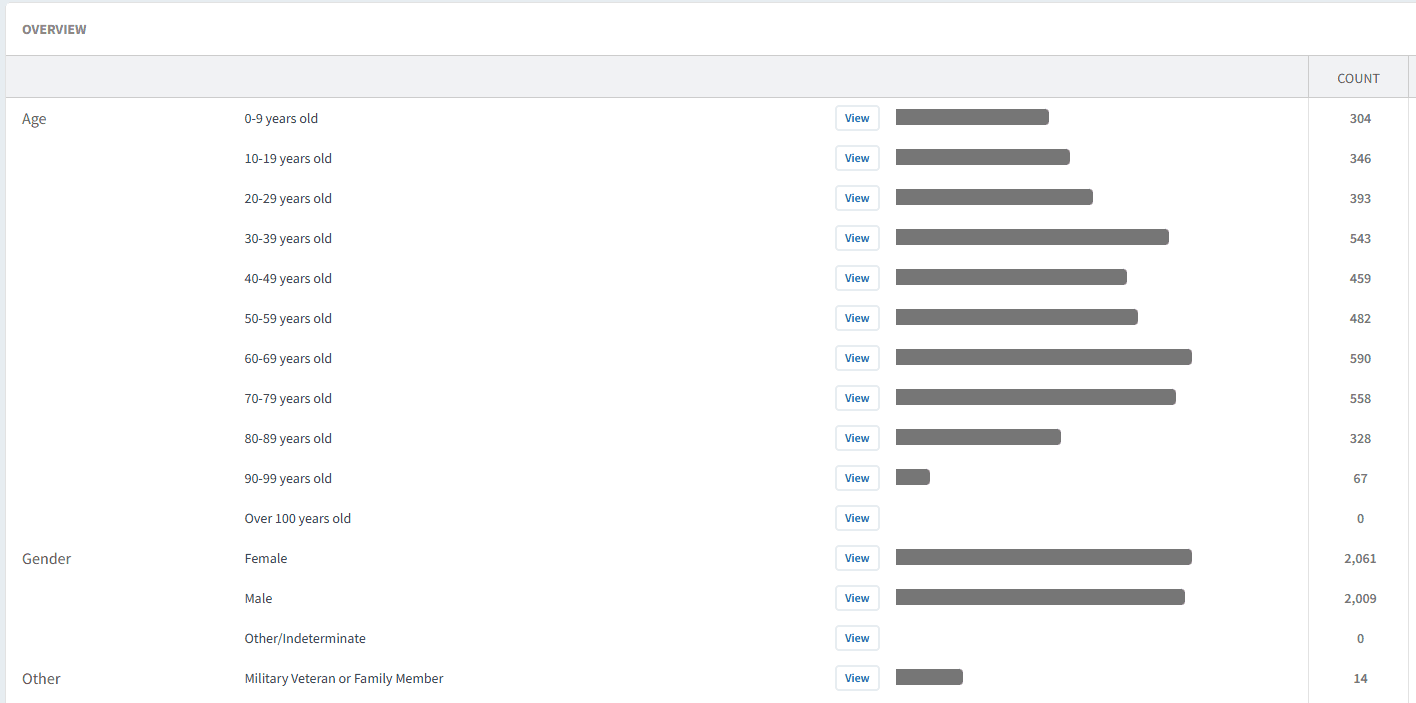
Overview
The Overview tab provides a high-level summary of the practice population, including:
Age distribution
Gender breakdown
Registration type
Veterans and military family members
National Data Opt-out status
Reasonable adjustments
Out-of-area patients
This information can support service planning and help practices understand population demand.
For example:
Reviewing older age groups may help anticipate increased frailty or long-term condition workload
Monitoring reasonable adjustment coding may support accessibility planning
Reviewing veteran status may support targeted health initiatives
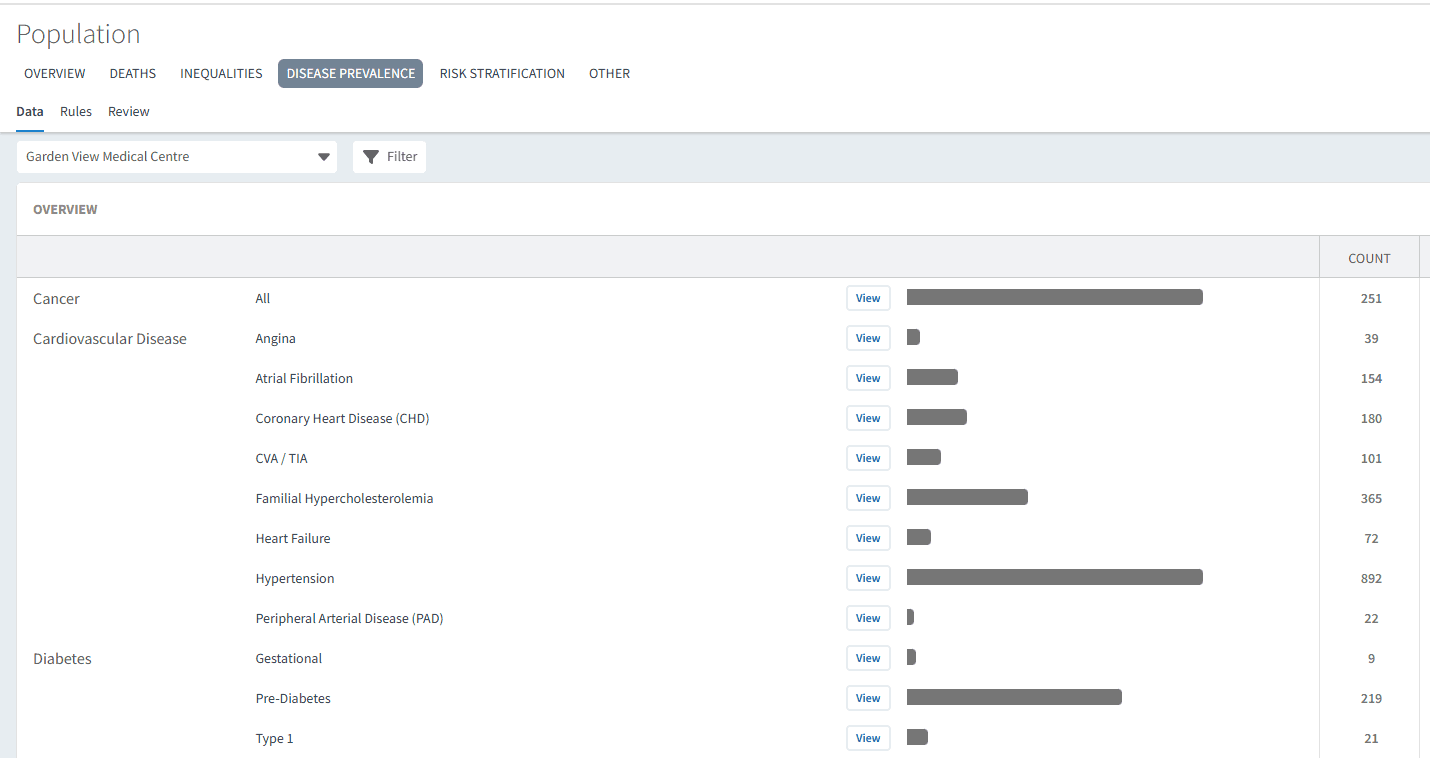
Disease Prevalence
The Disease Prevalence tab provides insight into long-term conditions and clinical prevalence across the registered population.
This can support:
Service planning
Long-term condition management
Workforce and clinic capacity planning
Population health reviews
For example:
Increasing COPD prevalence may indicate demand for additional respiratory clinic capacity
Rising diabetes prevalence may support targeted prevention or recall activity
👥 Identify Patients
The dashboard can help practices identify patients who may require targeted intervention, proactive monitoring, or additional support.
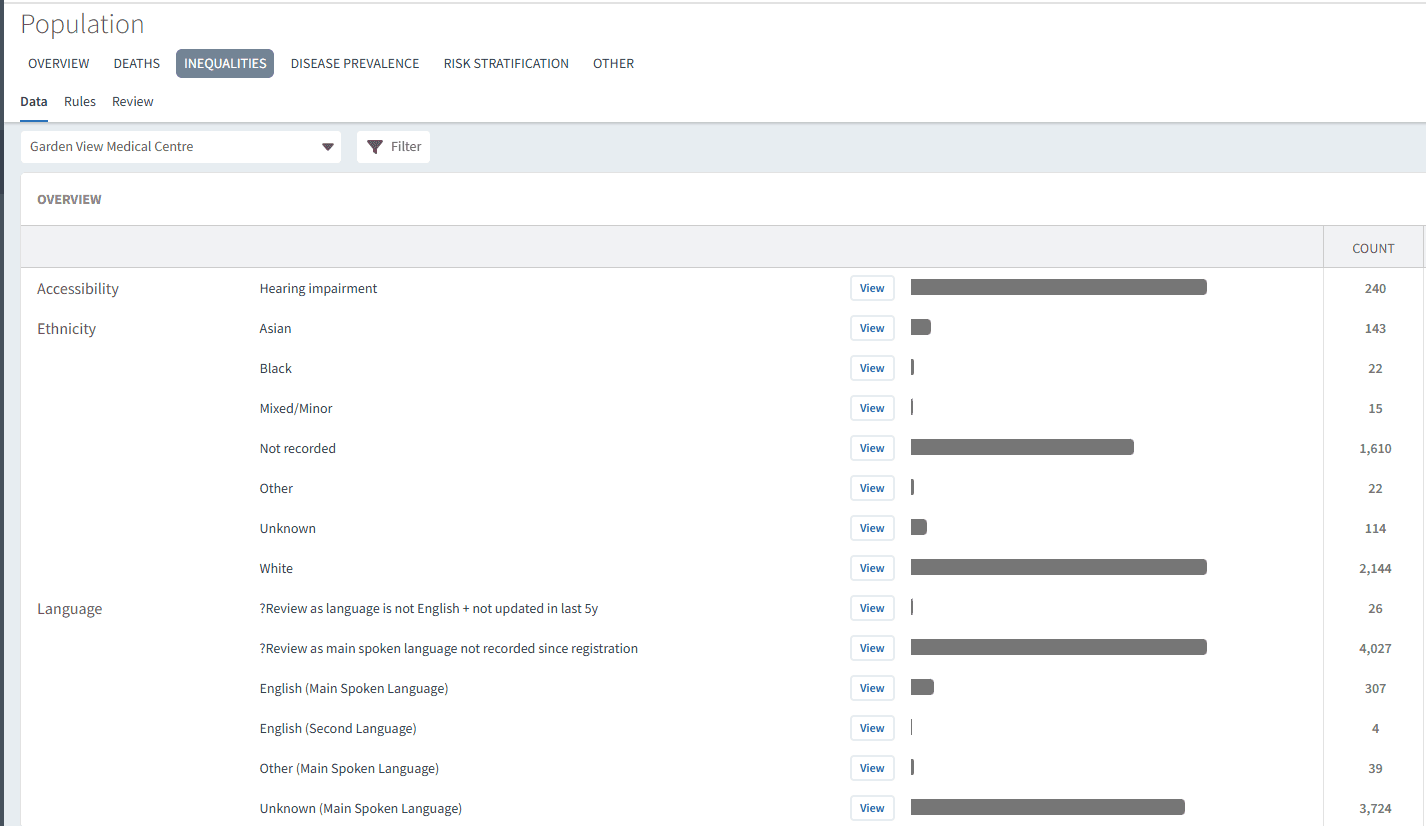
Inequalities
The Inequalities tab helps identify patient groups who may experience barriers to care or poorer health outcomes.
Examples may include:
Patients living in areas of deprivation
Patients requiring reasonable adjustments
Patients at risk of digital exclusion
Ethnicity-related population trends
This information can support targeted population health initiatives and help reduce variation in care delivery.
For example:
Practices may use this information to improve screening uptake in underserved groups
Care coordinators may identify patients requiring interpreter services or accessibility support
Risk Stratification
The Risk Stratification tab supports the identification of patients at increased risk of deterioration, hospital admission, or complex care needs.
This may support:
Proactive frailty management
MDT discussions
Care coordinator reviews
Anticipatory care planning
📄 Review Mortality
The dashboard also includes reporting areas to support practices with mortality monitoring, audit activity, and additional population analysis.
Deaths
The Deaths tab provides visibility of recorded patient deaths within the practice population.
This information may support:
Mortality reviews
Audit activity
Data quality checks
Population trend analysis
❓ FAQs
Can patient lists be exported?
Yes. Patient cohorts can be exported where enabled within your organisation’s permissions.
🏫 Additional Support
To further your understanding of the Ardens Manager platform:
Book training for your GP Practice, PCN or ICB.
Contact our Support Team for support in real time.