
ℹ️ Introduction
This article explains how to use Ardens Manager to monitor and review lifestyle-related activity across your organisation. By the end, you will be able to track key lifestyle information and use the dashboard to support population health management and performance.
Background
Lifestyle factors such as smoking, alcohol consumption, substance misuse, and weight significantly impact patient health outcomes. Monitoring these areas enables practices to identify at-risk populations, support preventative care, and meet public health and contractual targets.
How Ardens Can Help
Ardens Manager provides a Lifestyle that allows practices to:
Monitor lifestyle-related activity by category
Track trends and prevalence over time
Identify at-risk patient groups
Support preventative care and service planning
✅Included in Ardens Manager National Content package: Interested in finding out more or requesting a trial? Contact accounts@ardens.org.uk
📍Access the Dashboard
Log into Ardens Manager.
Select the Services module from the left sidebar.
Open the Lifestyle dashboard.
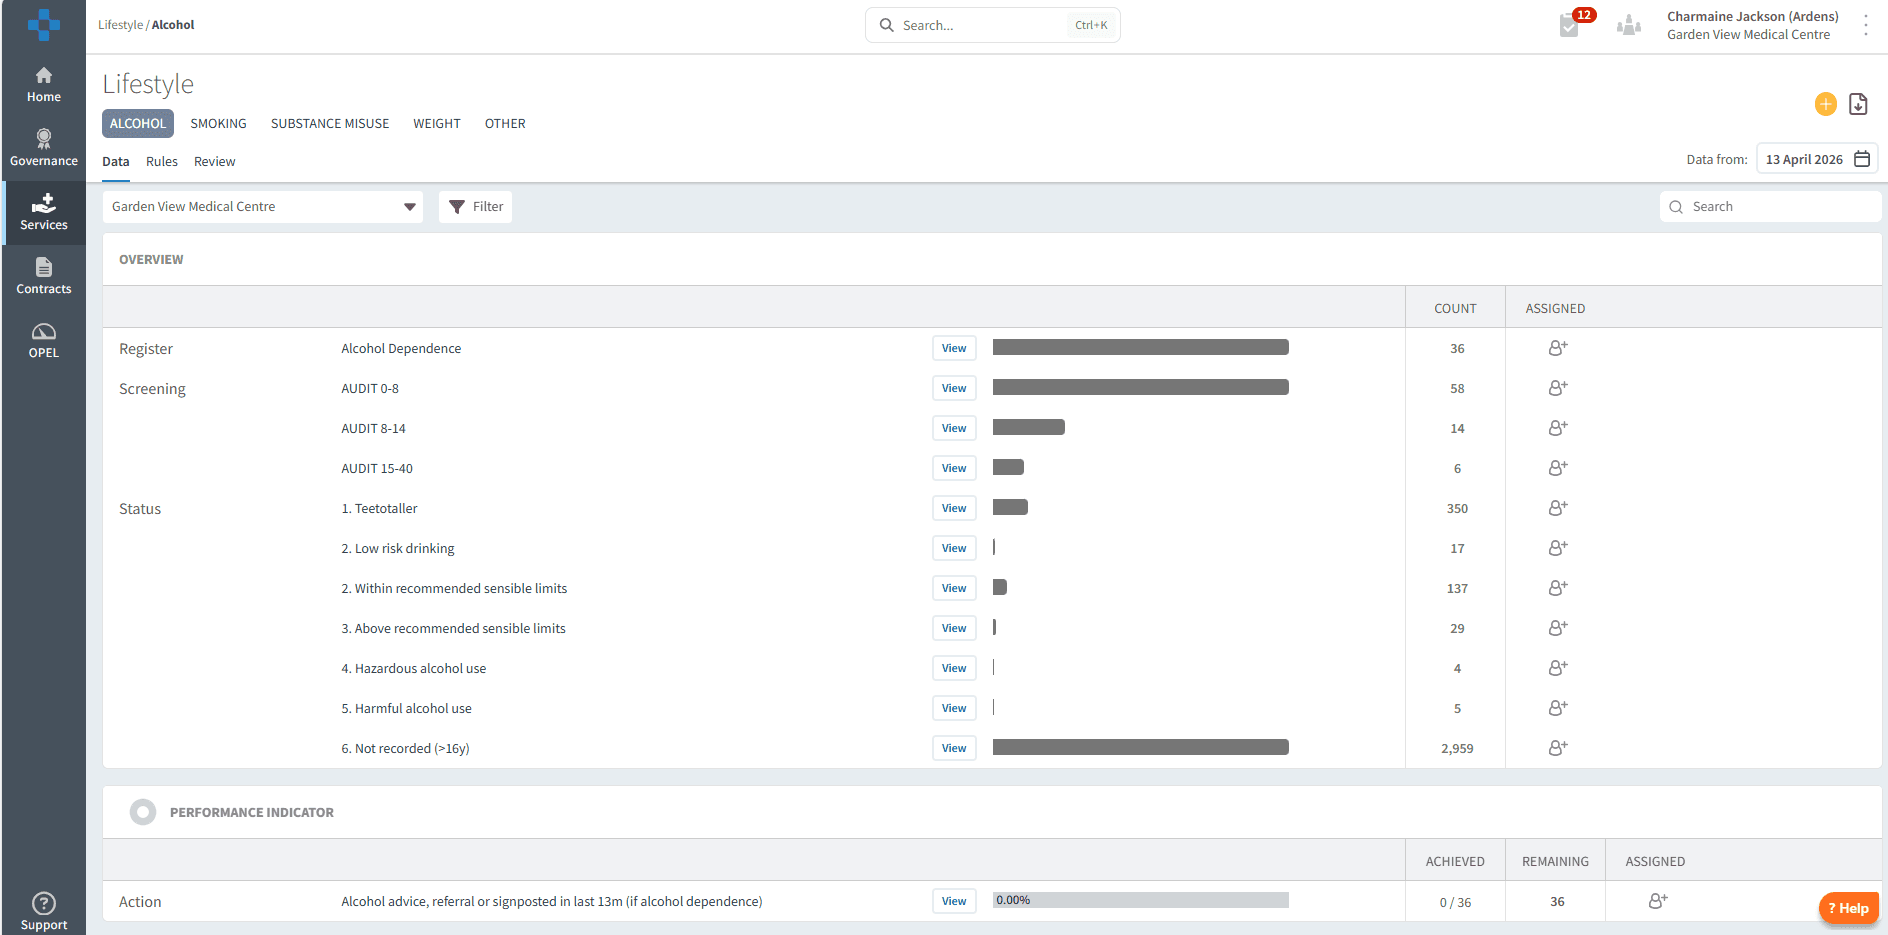
🔎 Review Data
The dashboard is filtered into tabs based on lifestyle factors, allowing you to quickly navigate and review specific areas of activity:
Alcohol: Monitoring alcohol consumption and identification of higher-risk drinking
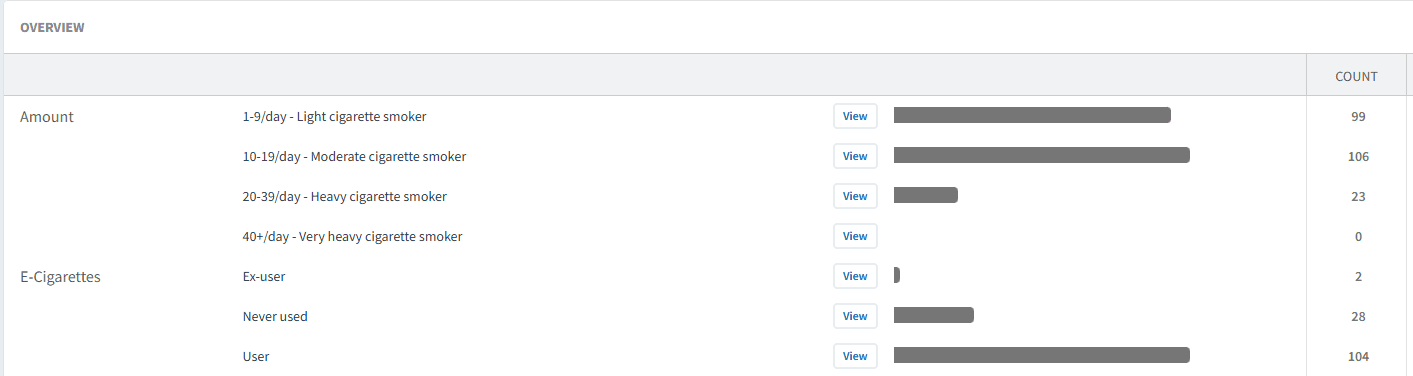
Smoking: Smoking status, prevalence, and cessation support activity
Substance Misuse: Includes drug and substance misuse and support
Weight: Covers BMI recording, obesity co-morbidities and trends
Each tab provides an overview of activity, helping you understand patterns, identify risk areas, and support high-level reporting and decision-making.
📄 Overview
This section provides a summary of lifestyle data across your organisation, allowing you to review registers, prevalence, trends, and overall activity.
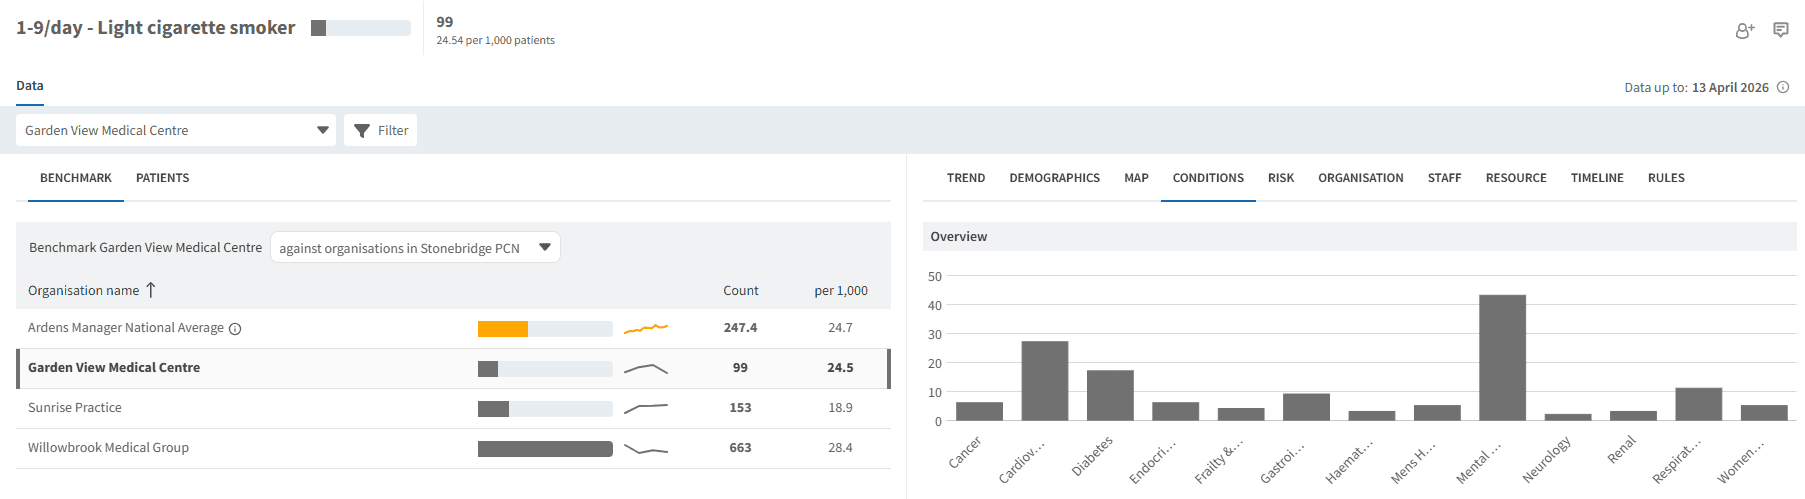
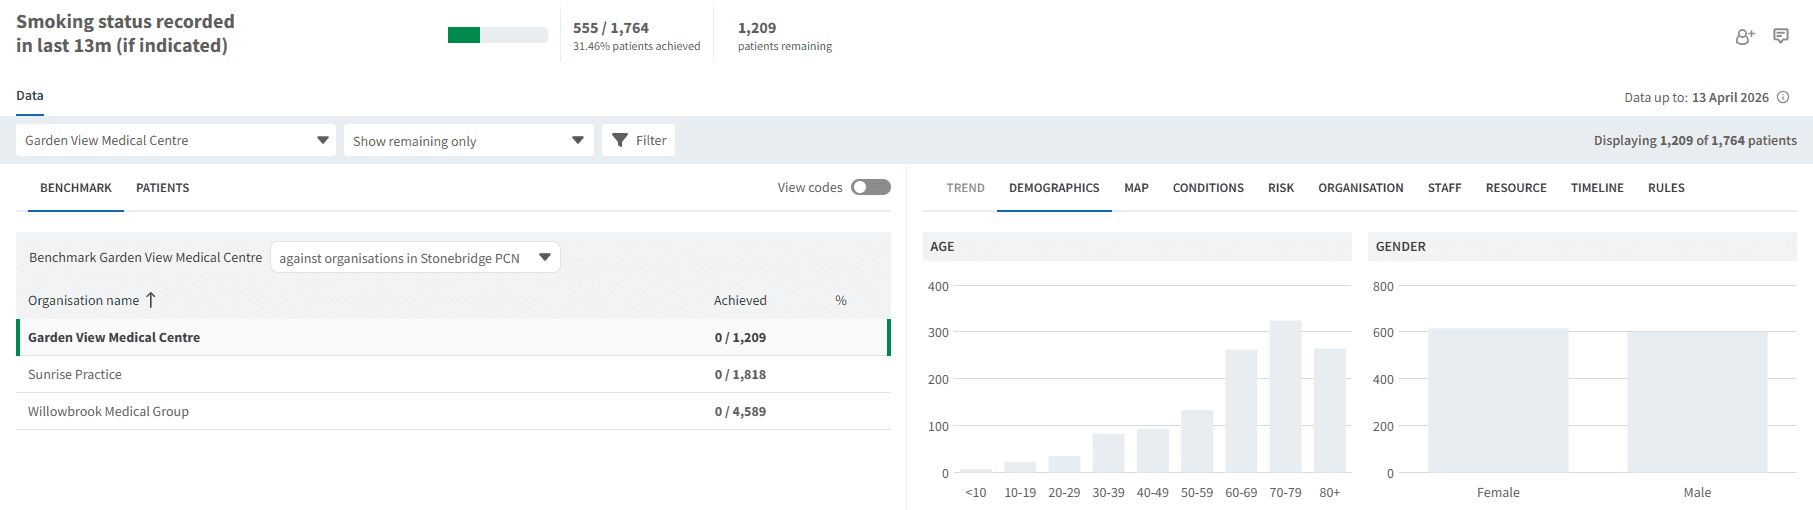
Select the View button next to the report to explore the data in more detail. From here, you can break it down by patient demographics, trends, and patient conditions.
📊 Performance Indicators
This section highlights key performance indicators for lifestyle data, supporting quality improvement and ensuring appropriate recording and intervention.
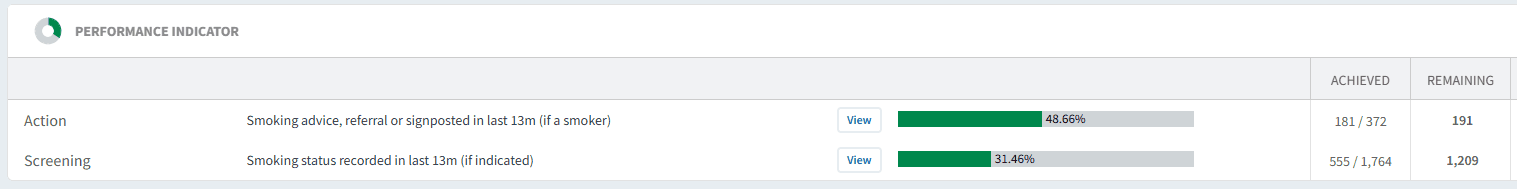
Select the View button next to the report, then apply the Show remaining only filter to identify work that is still outstanding. Use the PATIENTS tab to view and identify the patients included in this list.
❓ FAQs
Can I identify patients who need intervention?
Yes, by using the View option and applying filters (such as “Show remaining only”), you can identify patients who may require review or support.
Can I filter the data?
Yes, the Single Report screen allows filtering by demographics, trends, and risk groups.
How can this dashboard support population health?
It helps identify at-risk groups, monitor trends, and target interventions to improve patient outcomes.
🏫 Additional Support
To further your understanding of the Ardens Manager platform:
Book training for your GP Practice, PCN or ICB.
Contact our Support Team for support in real time.