
ℹ️ Introduction
This article explains how to use the Ardens Manager Cardiovascular dashboards to understand prevalence, assess clinical risk, monitor activity, and evaluate the quality of care across all major cardiovascular conditions. By the end of this guide, you will be able to use these insights to support planning, targeted interventions, clinical governance, and service improvement across your practice, PCN or ICB.
Background
Cardiovascular disease remains a leading cause of morbidity and health inequality, requiring proactive detection, structured management and regular review. Organisations need oversight of prevalence, risk, and care quality across multiple related conditions to deliver effective and equitable cardiovascular services.
For practices, PCNs and ICBs, it is important to:
Understand prevalence and population characteristics across all cardiovascular conditions.
Monitor risk and disease‑specific control measures (e.g., blood pressure, rhythm status, heart failure stability, lipid levels).
Ensure appropriate follow‑up, medicines optimisation and safety monitoring.
Identify unwarranted variation in diagnosis, treatment, outcomes and workforce activity
How Ardens Can Help
The Ardens Manager Cardiovascular suite brings together dashboards for:
Atrial Fibrillation (AF)
Coronary Heart Disease (CHD)
Heart Failure (HF)
Hypertension
Peripheral Arterial Disease (PAD)
Stroke / TIA
Cardiovascular Prevention
Familial Hypercholesterolaemia (FH)
Each dashboard follows a consistent structure, enabling organisations to analyse prevalence, review activity, identify risk, and evaluate performance across all cardiovascular pathways.
The Ardens Manager Cardiovascular dashboards works alongside the existing Ardens Clinical resources to support high-quality cardiovascular care. To learn more about the clinical resources, access the support articles below:
✅Included in Ardens Manager National Content package: Interested in finding out more or requesting a trial? Contact accounts@ardens.org.uk
📍 Access the Dashboard
Log into Ardens Manager.
Go to Services on the left-hand pane.
Open to Conditions folder.
Click on Cardiovascular.
Click on the required condition tab.
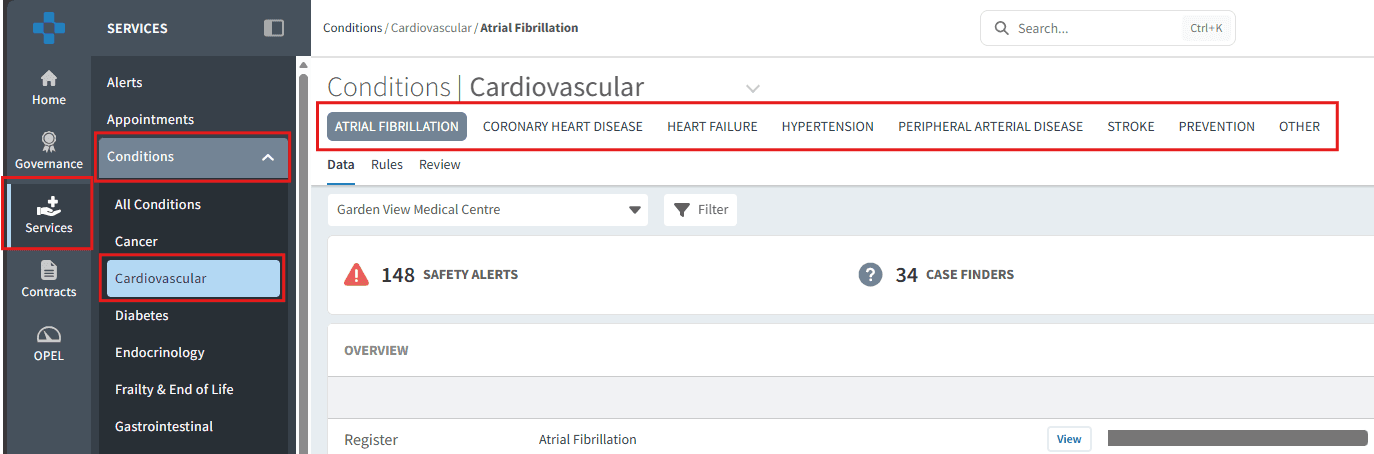
📊 Plan & Forecast Demand
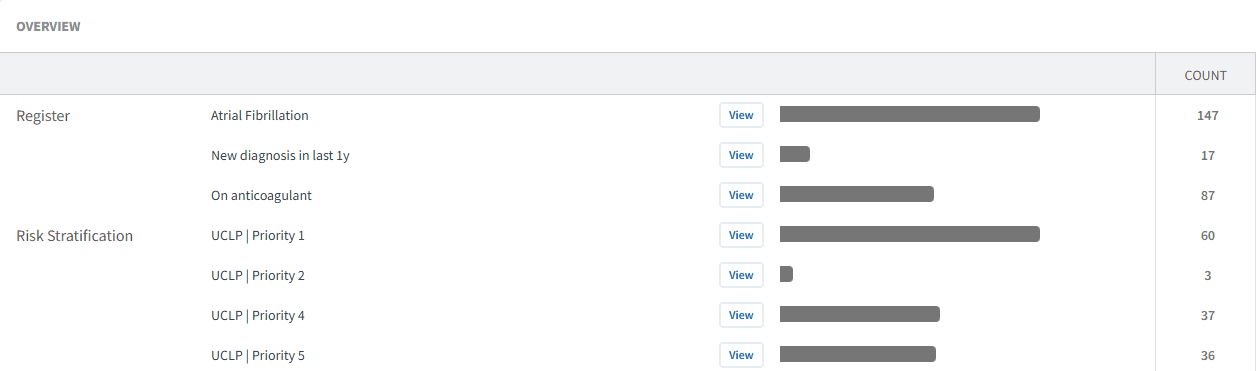
The Overview section of each conditions tab enables organisations to analyse coded registers, identify population trends, and plan workforce and recall activity accordingly.
Understand Your Population
The registers provide visibility of patients coded with the condition, helping you understand:
Recorded prevalence within your organisation.
Coding patterns.
The size of the cohort requiring review or monitoring.
Condition specific risk.
This insight supports informed service planning and helps ensure capacity aligns with patient needs.
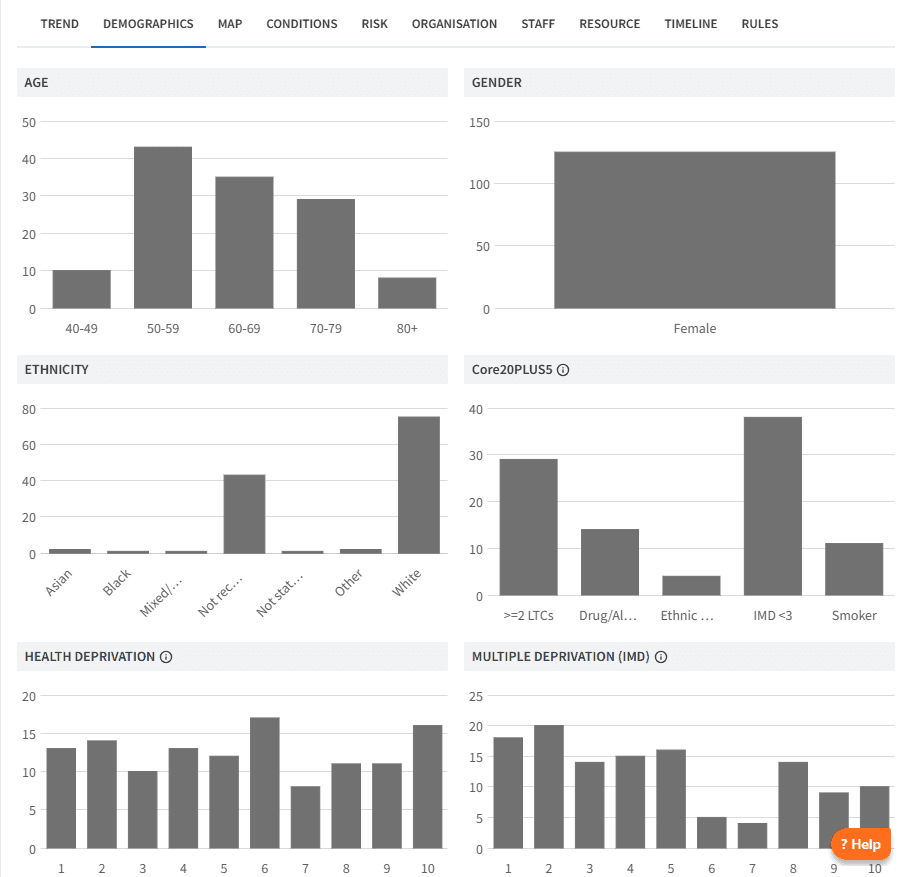
To review registers:
Click the View button next to the required register report.
Review the Demographic tab to understand age distribution and deprivation.
Review the Conditions tab for breakdown by long-term condition and multimorbidity.
Review the Risk tab to identify patients in vulnerable or higher-risk groups.
Further insights enable organisations to review diagnosis patterns by clinician and by patient geographical location, supporting identification of variation and equitable access to care.
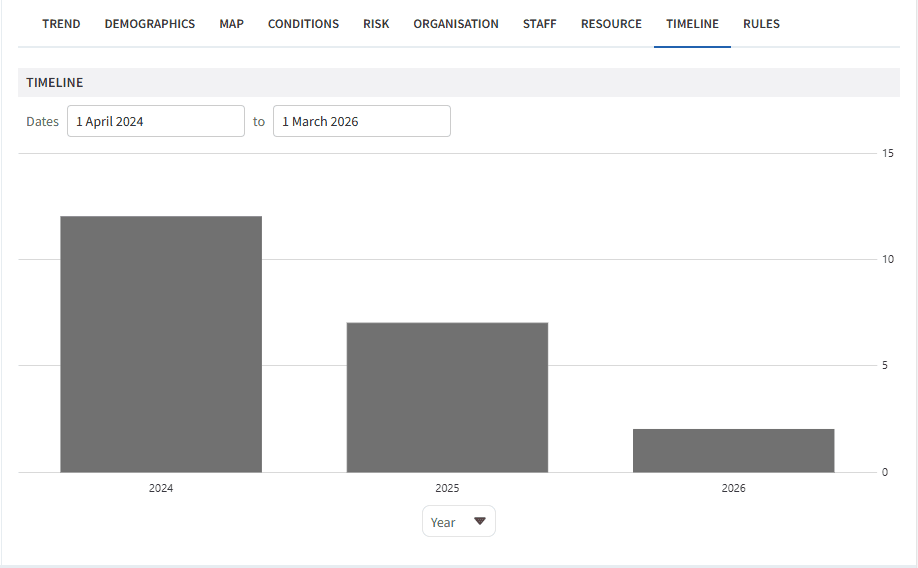
Analyse Trends
Understanding how registers change over time enables organisations to anticipate future workload and workforce requirements.
To analyse trends:
Click the View button next to the required register report.
Click on the Timeline tab.
Below the timeline, select the drop-down field and choose Year (or another timeframe).
This allows you to:
Analyse trends in diagnosis rates.
Identify an increase in demand.
Inform capacity considerations vs potential demand.
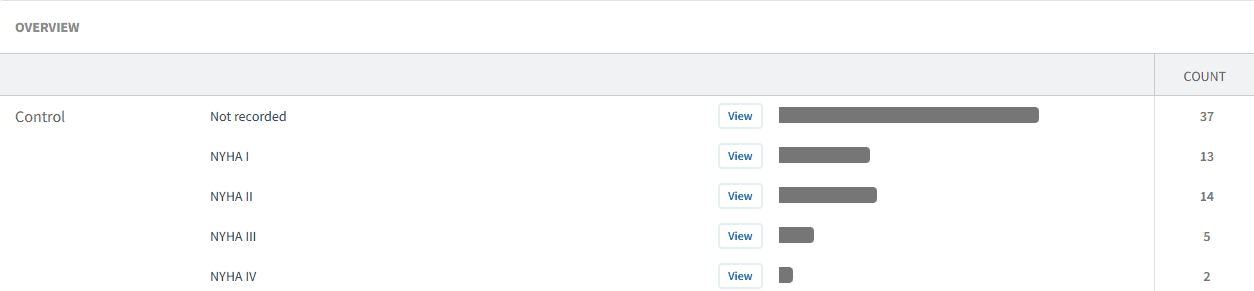
Condition-Specific Risk
Risk stratification provides a structured method for identifying high‑risk cohorts, targeting recalls, and focusing workforce capacity where it has greatest impact. Each cardiovascular condition applies different risk tools, but the principle remains consistent across the suite.
Examples include:
Heart Failure: NYHA classification, signals of clinical instability
Atrial Fibrillation: UCLP stratification
Hypertension: UCLP stratification
CHD and Stroke: secondary‑prevention risk patterns
FH: lipid levels and treatment optimisation
Prevention: UCLP Primary and Secondary Prevention
🔎 Monitor Activity & Safety
The dashboard provides tools to support clinical governance and patient safety, including Safety Alerts, Case Finders, and Performance Indicators.
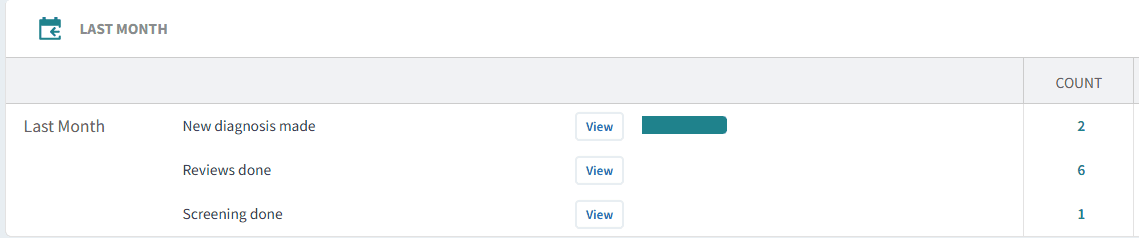
Last Month Activity
All cardiovascular dashboards include an activity summary for the previous month showing new diagnosis along with completion of reviews and screening.
Teams can use this to monitor workload, identify capacity strains and visualise trends.
To review activity:
Click the View button next to the required activity report.
Review the Demographic tab to understand age distribution and deprivation.
Review the Conditions tab for breakdown by long-term condition and multimorbidity.
Review the Risk tab to identify patients in vulnerable or higher-risk groups.
Review the Staff tab to understand which roles have carried out the activity.
Analyse the Timeline tab to understand demand patterns over the past month.
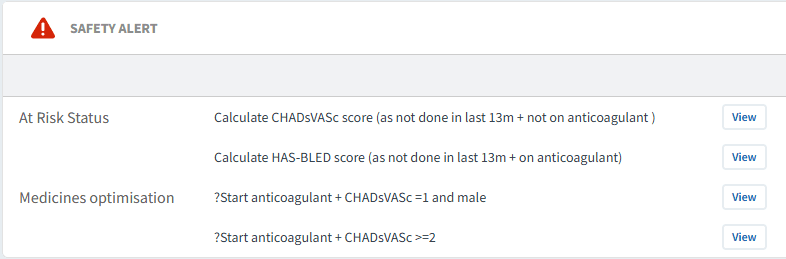
Safety Alerts
The Safety Alerts highlight patients who may require urgent review or medicines optimisation.
For each report:
Click View.
Select PATIENTS tab.
Review each patient record and take appropriate action.
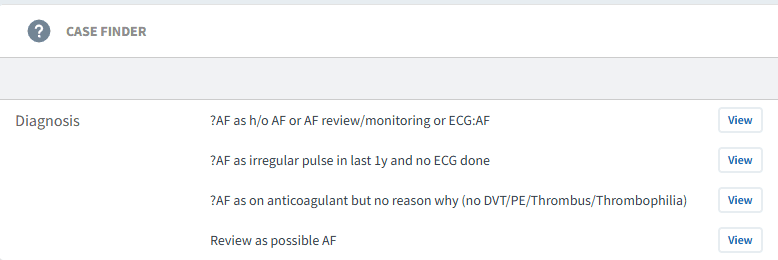
Case Finders
Case Finder reports identify patients who may be missing from the register as they lack a formal diagnosis code, even though their record suggests they may have the condition. This may be the result of incorrect or missed coding. These reports support proactive case identification and improve register accuracy.
For each report:
Click View.
Select PATIENTS tab.
Review each patient record.
If diagnosis is confirmed:
Add the appropriate diagnosis code in the clinical system.
This will move the patient onto the register and remove them from the case finder.
If inclusion is due to a data error:
Amend or remove the incorrect coding in the clinical system.
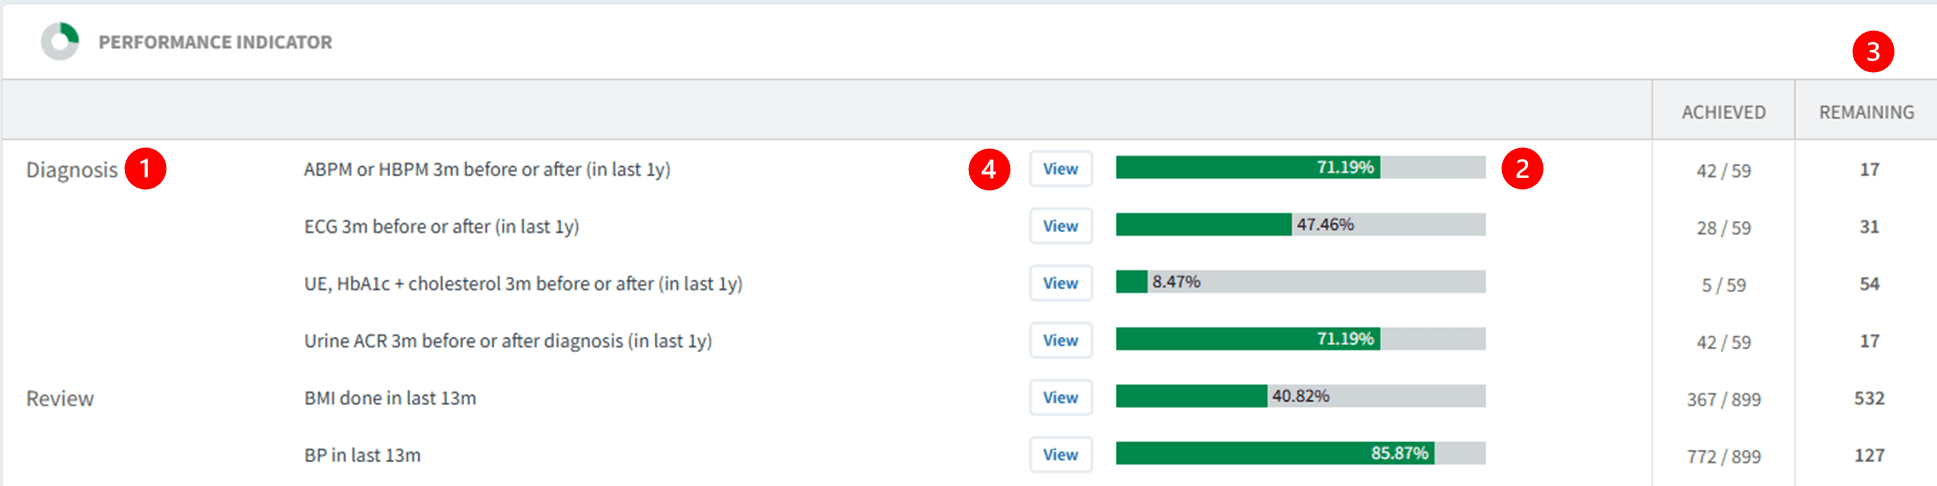
Performance Indicators
Across all cardiovascular dashboards, Performance Indicators monitor completion of key care components for each condition.
Reviewing performance indicators:
Indicators are categorised by diagnosis, review, target or screening.
Green performance bars show the percentage of completion across the cohort.
The Remaining column highlights patients who have not yet received specific care elements.
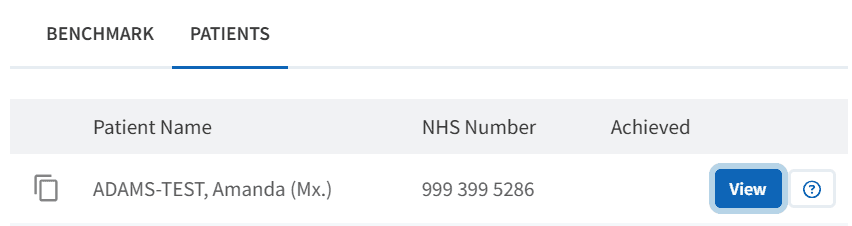
Click View to access the PATIENTS tab.
Above the patient list, select Show remaining only to review outstanding care.
⚠️ Please note: Patient data can be exported. Refer to this support article for further information.
Patient View for Follow-up
The Patient View functionality enables clinicians and teams to review outstanding elements of care at an individual patient level.
To access Patient View:
Click View next to the patient’s NHS number
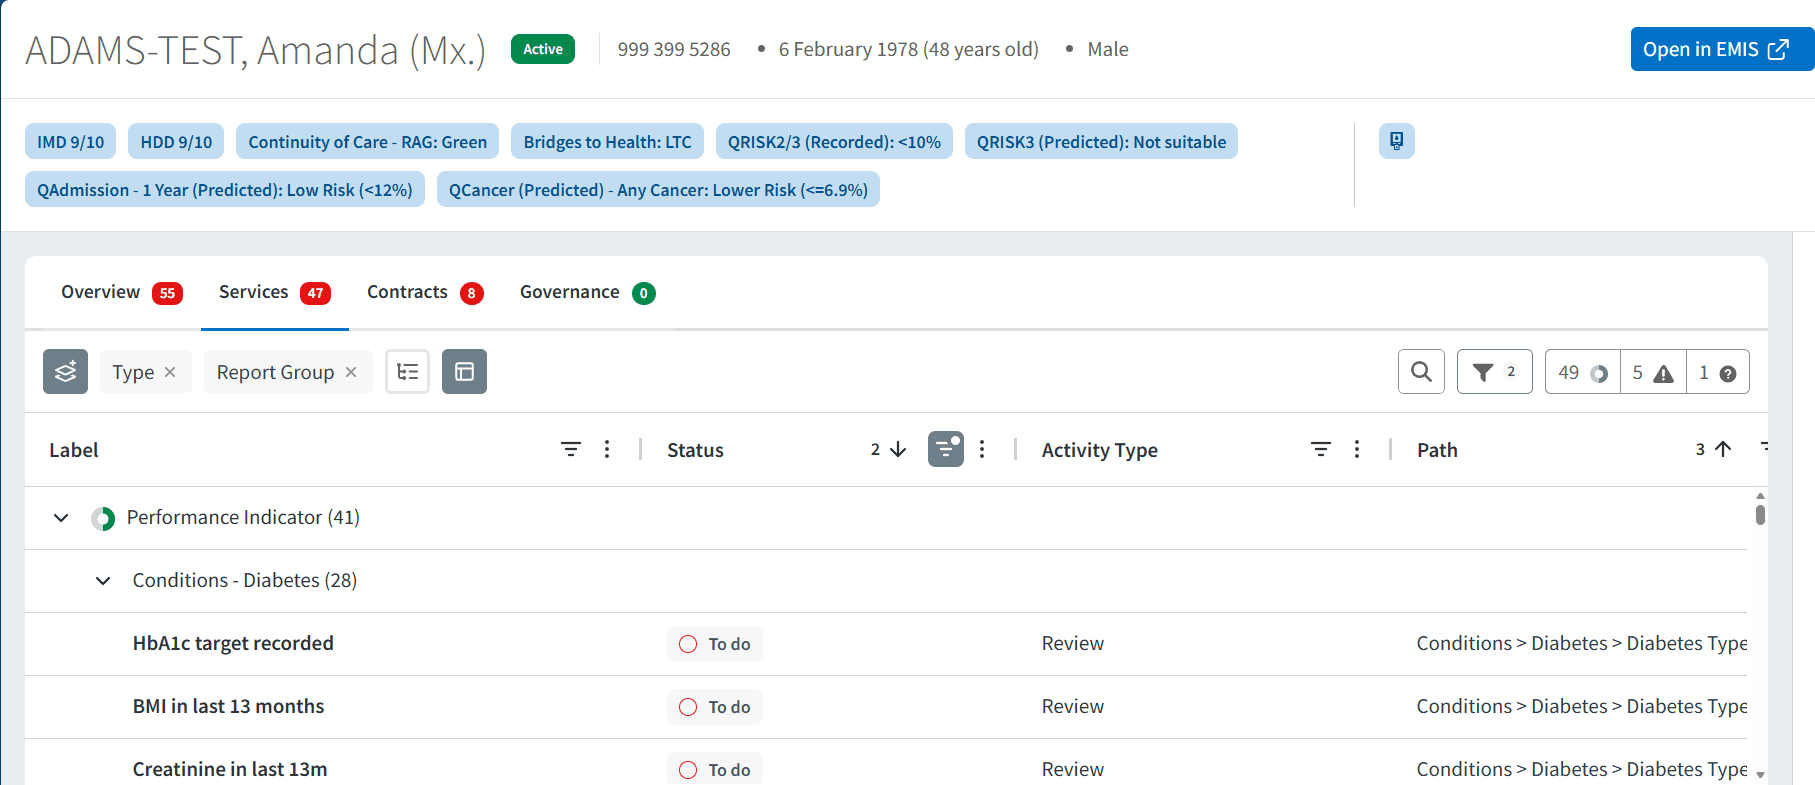
Within the patient view:
View all Ardens Manager findings for the patient across relevant reports
Highlight what still needs action
Use this as a prompt list, then review clinical details (history, repeat/long-term use, appropriateness) in the clinical system record
To take action:
Click Open in EMIS/SystmOne to review the full clinical record
Assess suitability of alternatives
Consider patient preference and clinical need
Complete any required medication changes
❓ FAQs
What is risk stratification and why is it included?
Risk stratification helps identify higher-risk groups so teams can target recalls and prioritise capacity where it has greatest impact. Risk tools vary by condition (for example, NYHA classification for Heart Failure or UCLP stratification for AF and Hypertension).
🏫 Additional Support
To further your understanding of the Ardens Manager platform:
Book training for your GP Practice, PCN or ICB.
Contact our Support Team for support in real time.