
ℹ️Introduction
This article explains how to use Breakdowns in Ardens Manager to analyse practice data by specific criteria, helping you better understand performance, population trends, and activity. By the end of this article, you will be able to apply and interpret different breakdowns to support reporting and decision-making.
Background
Looking at overall figures only tells part of the story. To fully understand patterns, variation, and trends, data often needs to be broken down in different ways. Breakdowns in Ardens Manager help practices, PCNs, ICBs, and public health teams explore their data more easily and gain clearer insights.
How Ardens Can Help
Ardens Manager provides a range of breakdown options that allow you to analyse data by specific criteria such as staff, demographics, geography, and clinical coding.
Key benefits include:
Improved visibility of population trends and variation.
Better understanding of workload distribution.
Support for operational planning and contractual requirements.
How to Access Breakdowns
Open the relevant Ardens Manager dashboard.
Locate a report, and click View to open the Single Report page.
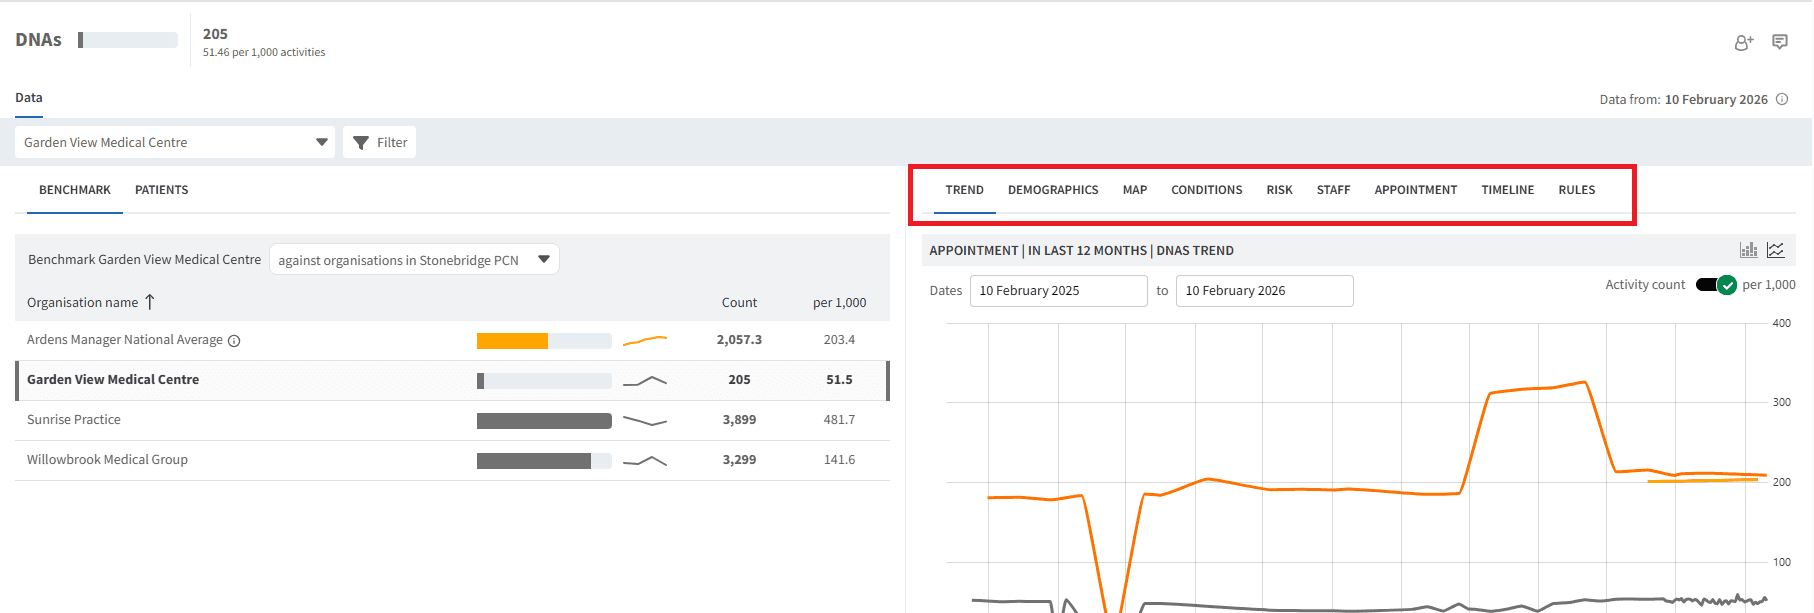
On the right-hand side of the screen, available breakdowns will be displayed, depending on the report you have accessed.
Toggle between the tabs to access different breakdown options.
⚠️Please note: Breakdowns can be further filtered to focus on specific cohorts. See the Search & Filter support article for guidance.
✅Available Breakdowns
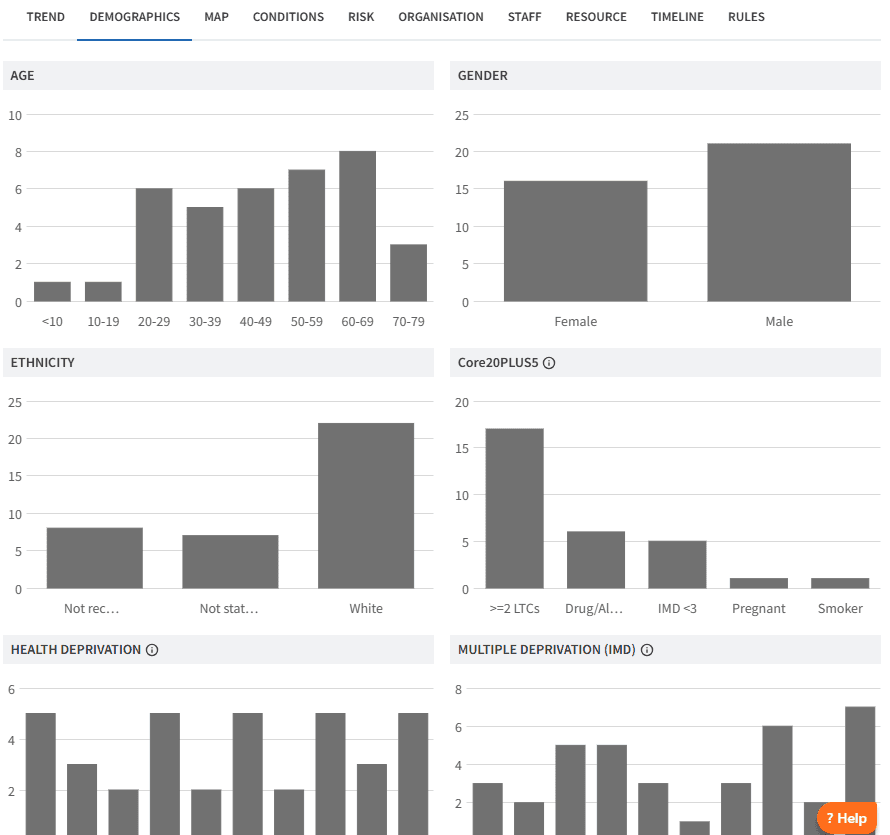
Demographics
Breakdown by patient characteristics such as age, gender, ethnicity, CORE20PLUS5, and health deprivation.
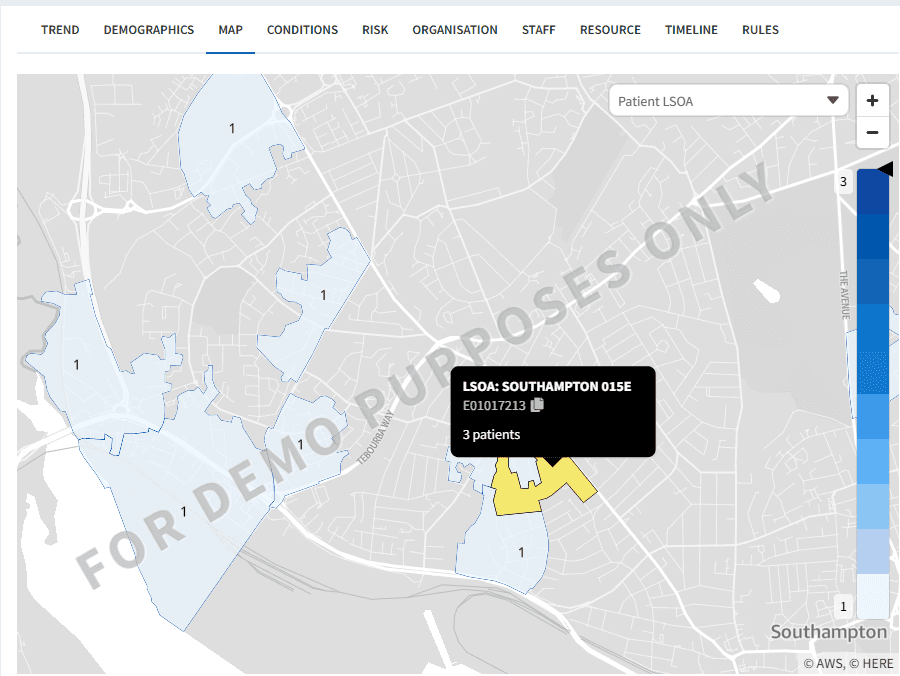
Map
Geographical breakdown to help identify patterns, trends and areas of focus across your patient population.
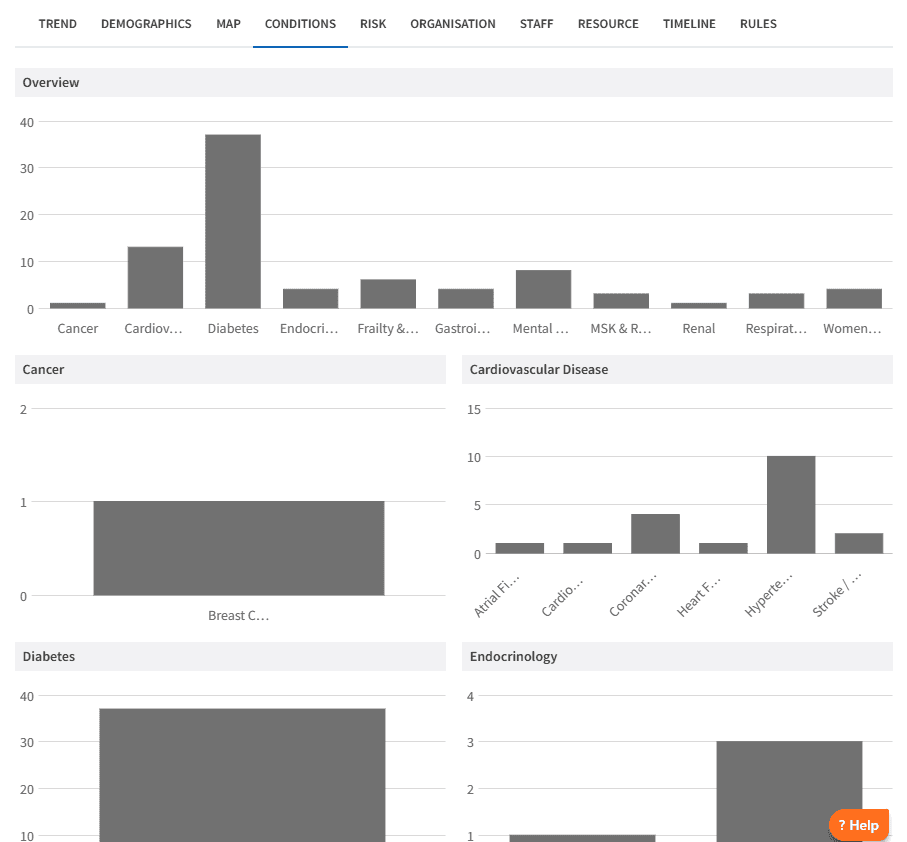
Conditions
Breakdown of patients by long-term conditions, making it easier to identify and prioritise those who may require additional attention.
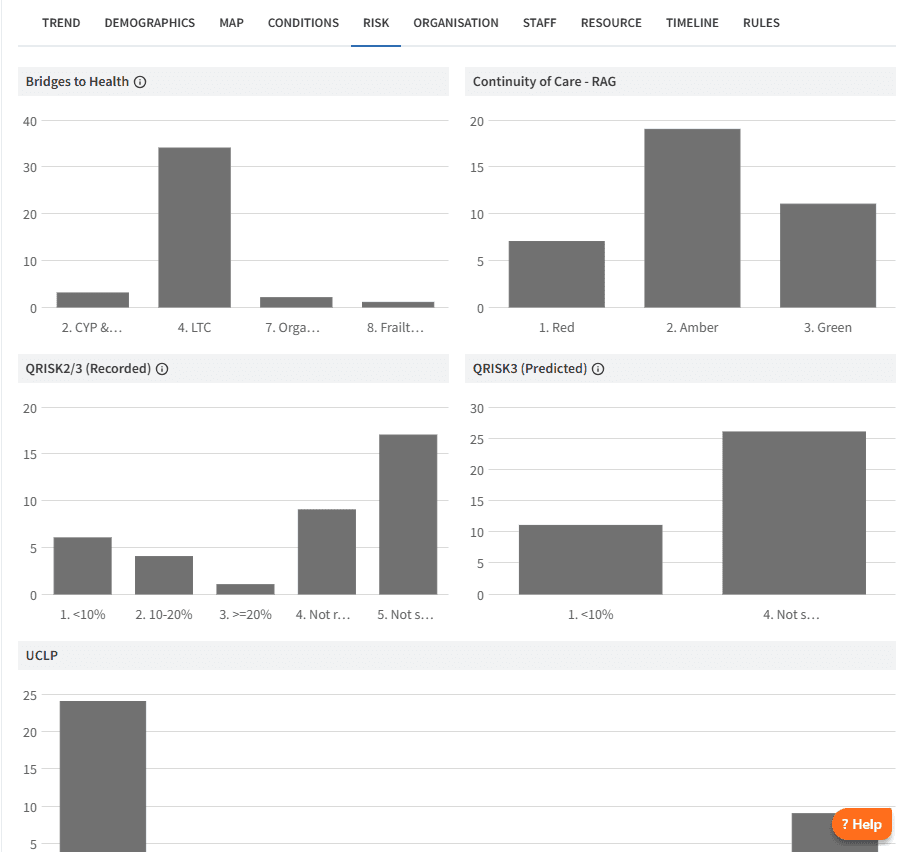
Risk
Categorises patients using established risk tools, including Bridges to Health, Continuity of Care (RAG), QRisk2/3, and UCLP, helping you identify those who may require closer monitoring or proactive care.
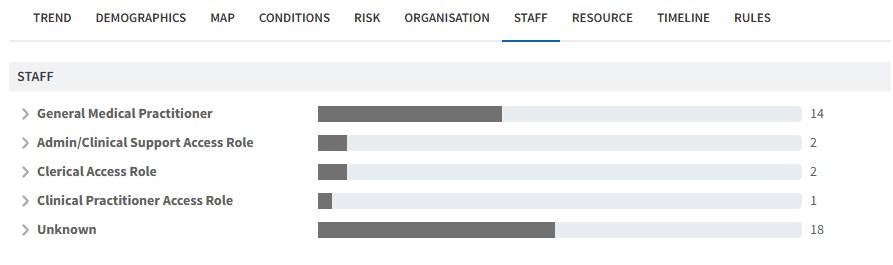
Staff
Analyse activity or outcomes by staff member or role to better understand workload distribution and variation across the team.
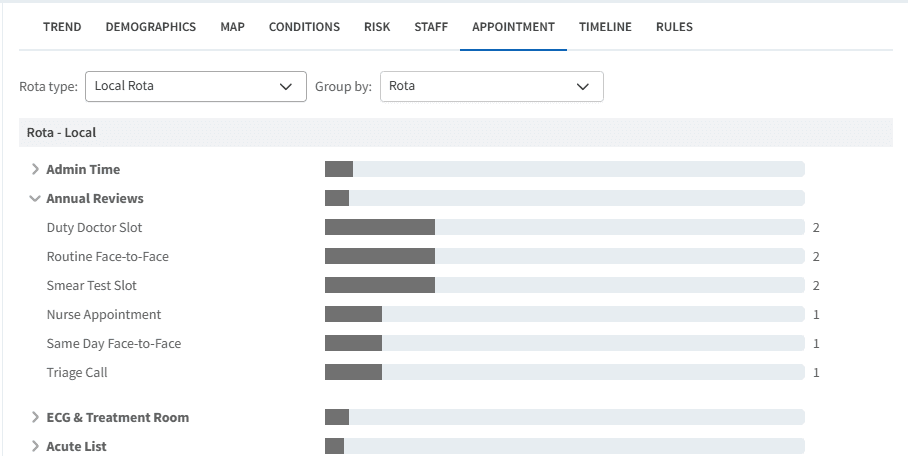
Appointment
Breakdown of data by appointment-related activity to support analysis of access and workload.
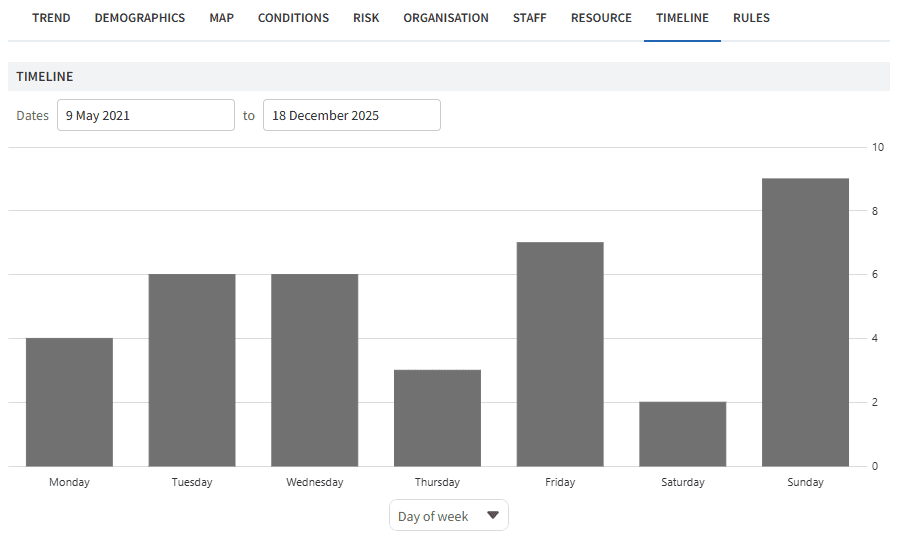
Timeline
Provides insight into data captured over time and can be narrowed down by day of week, week, month, quarter, or year.
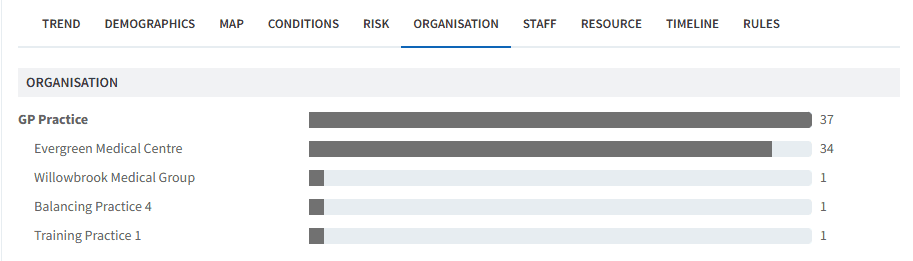
Organisation
Breakdown of data by organisation, supporting comparison and insight across different services and settings.
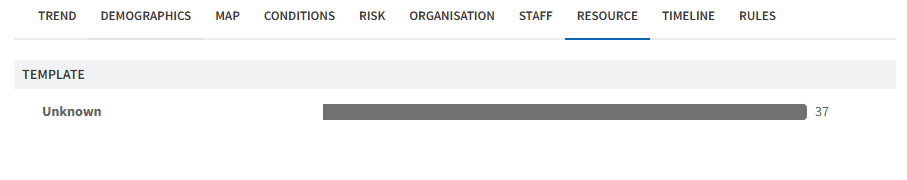
Resource
Provides insight into where data has been captured, such as specific templates. This is currently only available for SystmOne practices.
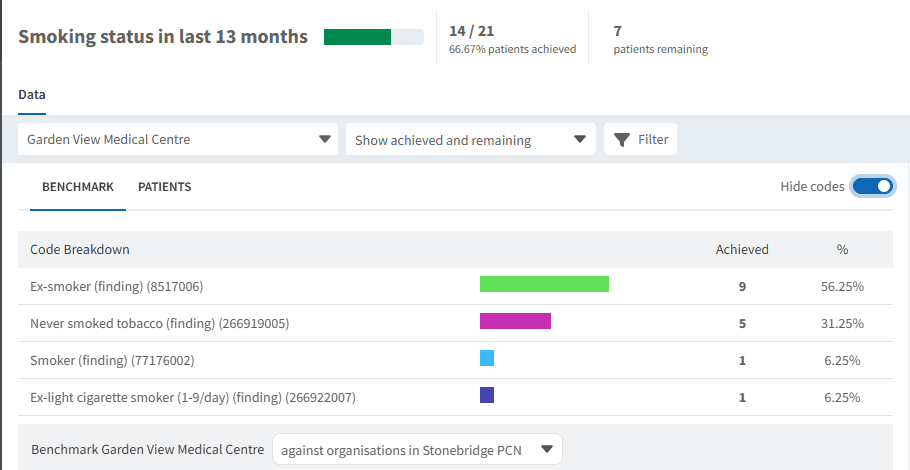
Codes
Breakdown by individual clinical codes contributing to the results.
❓FAQs
Are breakdowns available at PCN or organisational level?
Yes, where data permissions allow, breakdowns can be viewed across different organisational levels.
Do all dashboards support every breakdown type?
No, available breakdowns depend on the underlying data used in the dashboard.
🏫 Additional Support
To further your understanding of the Ardens Manager platform:
Book training for your GP Practice, PCN or ICB
Complete the Getting Started with Ardens Manager academy module
Contact our Support Team for support in real time