
ℹ️ Introduction
This article explains how to use the Ardens Manager Cancer dashboards to understand prevalence, monitor activity and evaluate the quality of cancer care. By the end of this guide, you will be able to use these insights to support service planning, care coordination and quality improvement across your practice, PCN or ICB.
Background
Cancer care requires coordinated, timely and well‑documented management across diagnosis, treatment and ongoing support. Primary care organisations play a vital role in maintaining accurate registers, supporting follow‑up and ensuring continuity of care for people living with and beyond cancer.
For GP practices, PCNs and ICBs, it is important to:
Understand cancer prevalence across tumour types.
Maintain accurate cancer registers.
Monitor new cancer diagnoses.
Ensure appropriate reviews and follow‑up activity are completed.
Identify variation in access, outcomes and workforce activity.
The Ardens Manager Cancer dashboards provide population‑level insight to support consistent, high‑quality cancer care delivery.
How Ardens Can Help
The Ardens Manager Cancer dashboards bring together insight to support cancer care across primary care settings.
The dashboards include:
An All Cancer register for population‑level oversight.
Individual cancer registers covering the top 10 cancers.
An Other Cancers category for additional cancer diagnoses.
This structure enables both high‑level population analysis and condition‑specific review. The dashboards support organisations to:
Analyse cancer prevalence.
Monitor new diagnoses.
Review activity and workforce involvement.
Evaluate quality and completeness of care delivery.
The Cancer dashboards work alongside existing Ardens Clinical resources to support cancer care management. To learn more about the clinical resources, access the support articles below:
✅Included in Ardens Manager National Content package: Interested in finding out more or requesting a trial? Contact accounts@ardens.org.uk
📍Access the Dashboard
Log into Ardens Manager.
Select Services from the left‑hand pane.
Open the Conditions folder.
Click on Cancer.
Select the required Cancer Care tab.
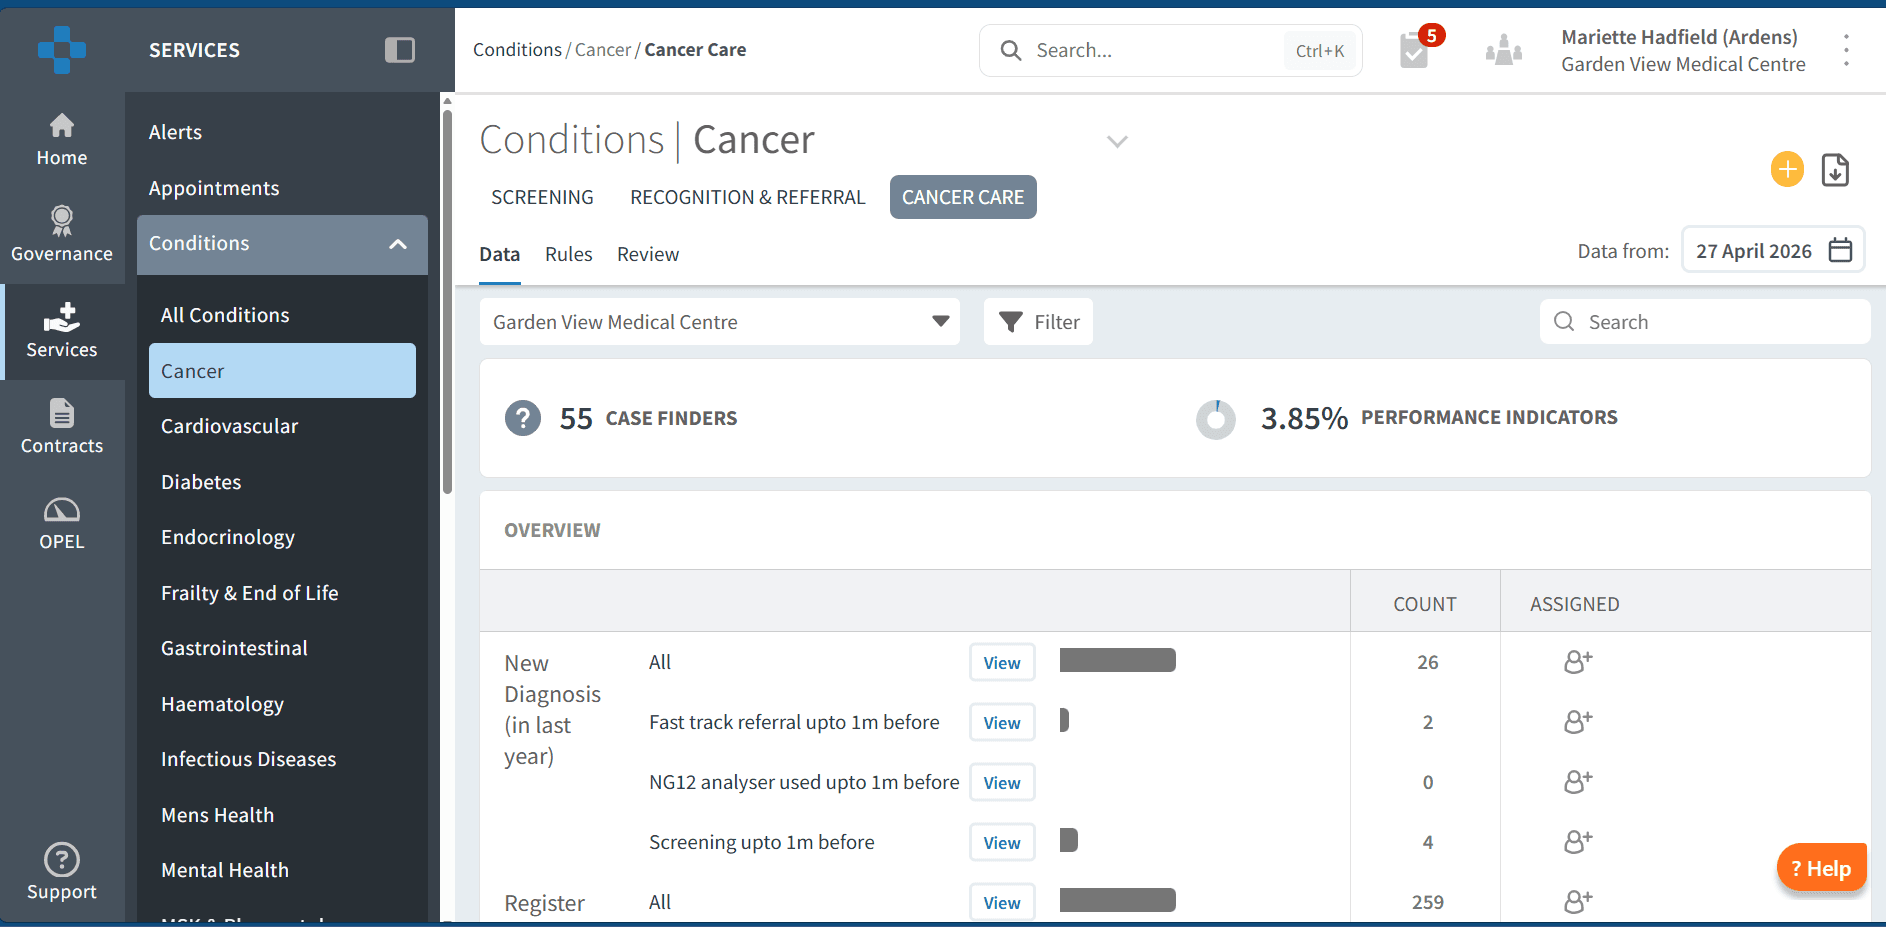
📊 Plan & Understand Demand
The Overview section supports understanding of cancer prevalence and trends across the organisation.
Understand Your Population
The Cancer registers provide visibility of patients coded with a cancer diagnosis, helping organisations understand:
Recorded prevalence across all cancers.
Distribution by cancer type.
Population demographics.
Coding patterns and register accuracy.
Size of the cohort requiring review or follow‑up.
This insight supports service planning and care coordination.
To review registers:
Click View next to the required register.
Review the Demographic tab to understand age distribution and deprivation.
Review the Conditions tab to understand multimorbidity and co‑existing conditions.
Additional analysis allows review of diagnosis patterns by clinician and by patient geography.
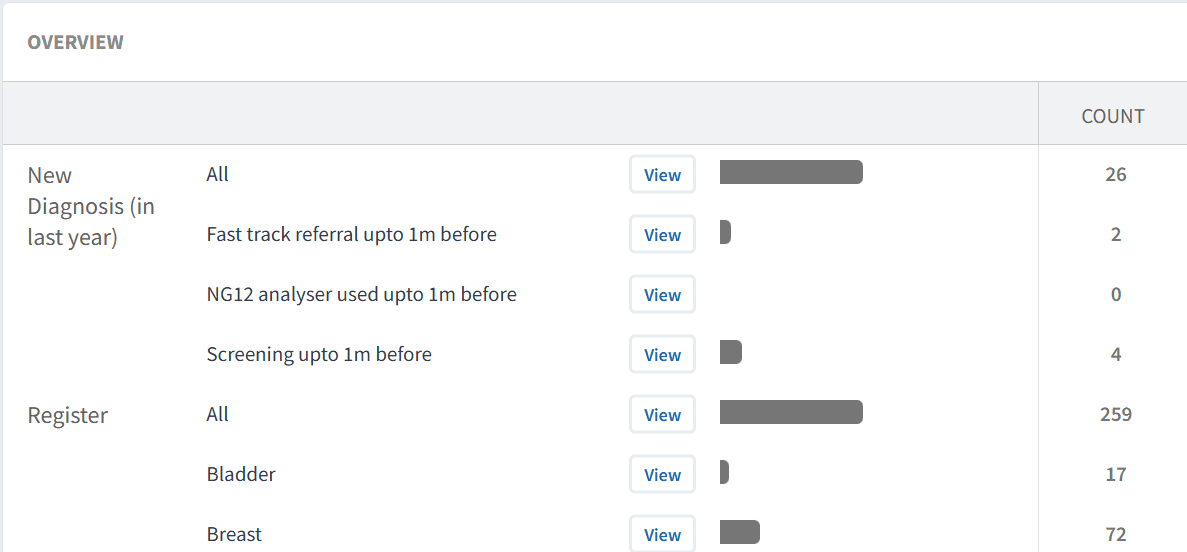
New Cancer Diagnoses
The Overview section includes insight into new cancer diagnoses, supporting monitoring of:
Recent activity.
Changes in demand.
Impact on workload and follow‑up requirements.
To review new diagnoses:
Click View on the relevant new diagnosis report.
Review patient characteristics using the available tabs.
Use the Timeline tab to understand trends over time.
Analyse Trends
Understanding how cancer registers change over time helps organisations monitor service demand and population need.
To analyse trends:
Click View next to the required register.
Open the Timeline tab.
Select Year (or another timeframe) from the drop‑down below the chart.
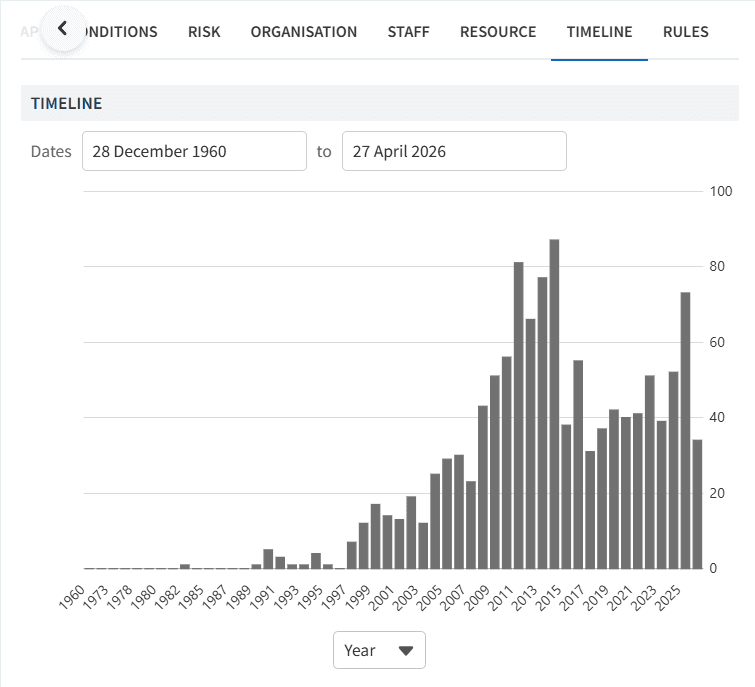
This supports:
Monitoring changes in prevalence.
Understanding trends in new diagnoses.
Informing capacity and workforce planning.
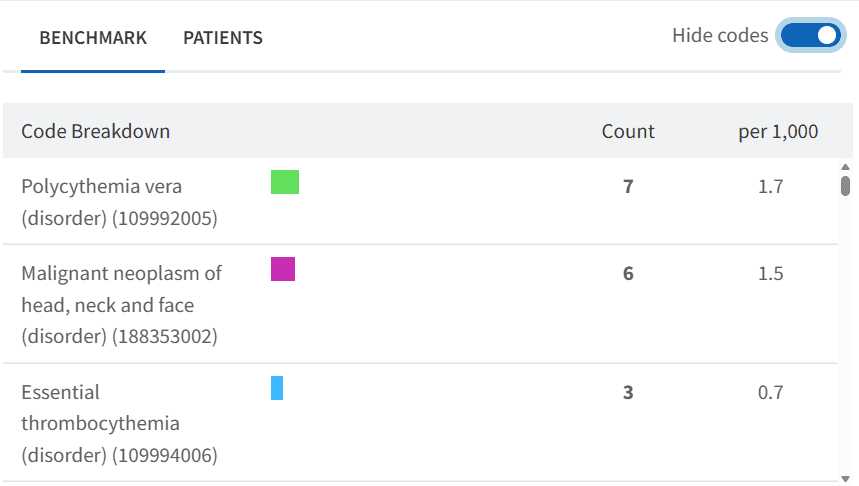
Using Code Breakdown
Some reports can be broken down by diagnosis coding, providing additional detail within a register.
Within the Other Cancers register, the code breakdown allows users to view the different cancer diagnoses included within this group.
This functionality supports more detailed analysis where individual cancer types are not shown as separate reports.
To access code breakdown:
Click View next to the relevant register report.
Select the View Codes toggle.
Select a specific cancer diagnosis code to review detailed insights for that cohort.
⚠️ Please note: This is particularly useful for exploring less common cancer types that are grouped within the Other Cancers category.
🔎 Monitor Activity & Quality
The Cancer dashboards include tools to support oversight of cancer‑related activity and quality of care delivery.
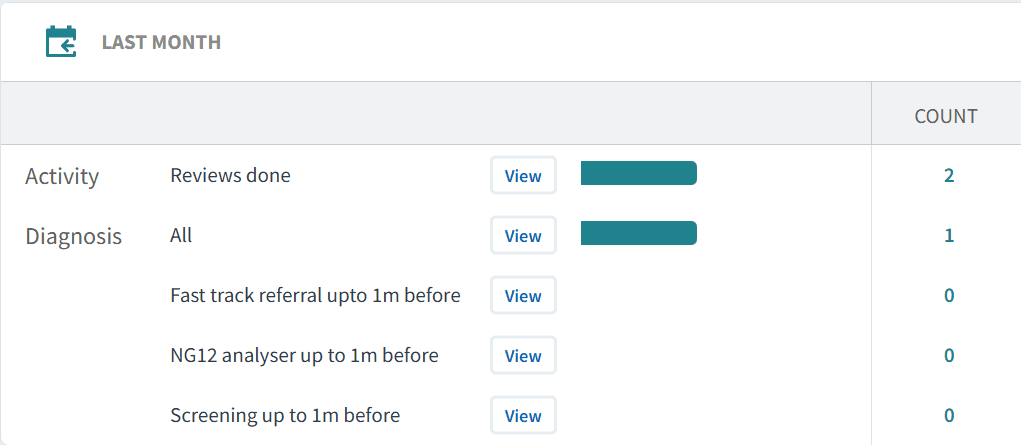
Last Month Activity
The dashboards provide a summary of activity for the previous month, including:
New cancer diagnoses recorded.
Reviews or follow‑up activity completed.
Workforce involvement by role.
To review activity:
Click View next to the activity report.
Review the Demographic, Conditions and Staff tabs.
Analyse the Timeline tab to understand recent workload patterns.
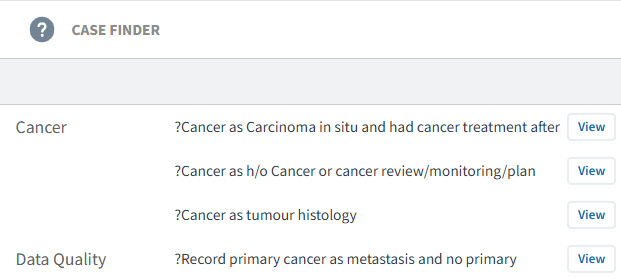
Case Finders
Case Finder reports identify patients who may have evidence of cancer within their record but are not yet coded with an appropriate diagnosis. These reports support:
Improved register accuracy.
Identification of missed or delayed coding.
Complete population visibility.
Using case finders:
Click View.
Select the PATIENTS tab.
Review each patient record.
If a cancer diagnosis is confirmed:
Add the appropriate diagnosis code in the clinical system.
The patient will move onto the relevant cancer register.
If inclusion is due to a data error:
Amend or remove incorrect coding in the clinical system.
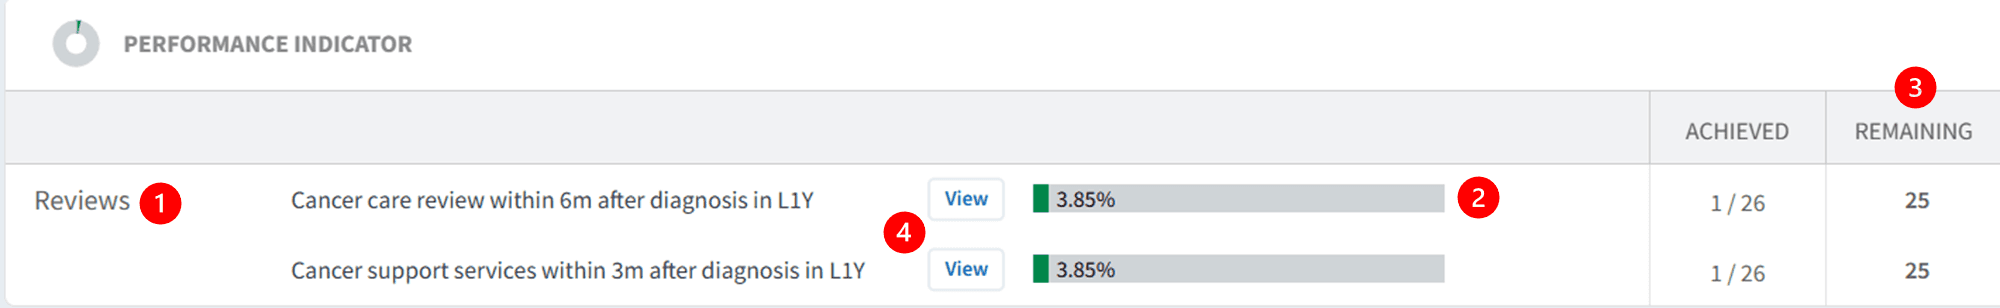
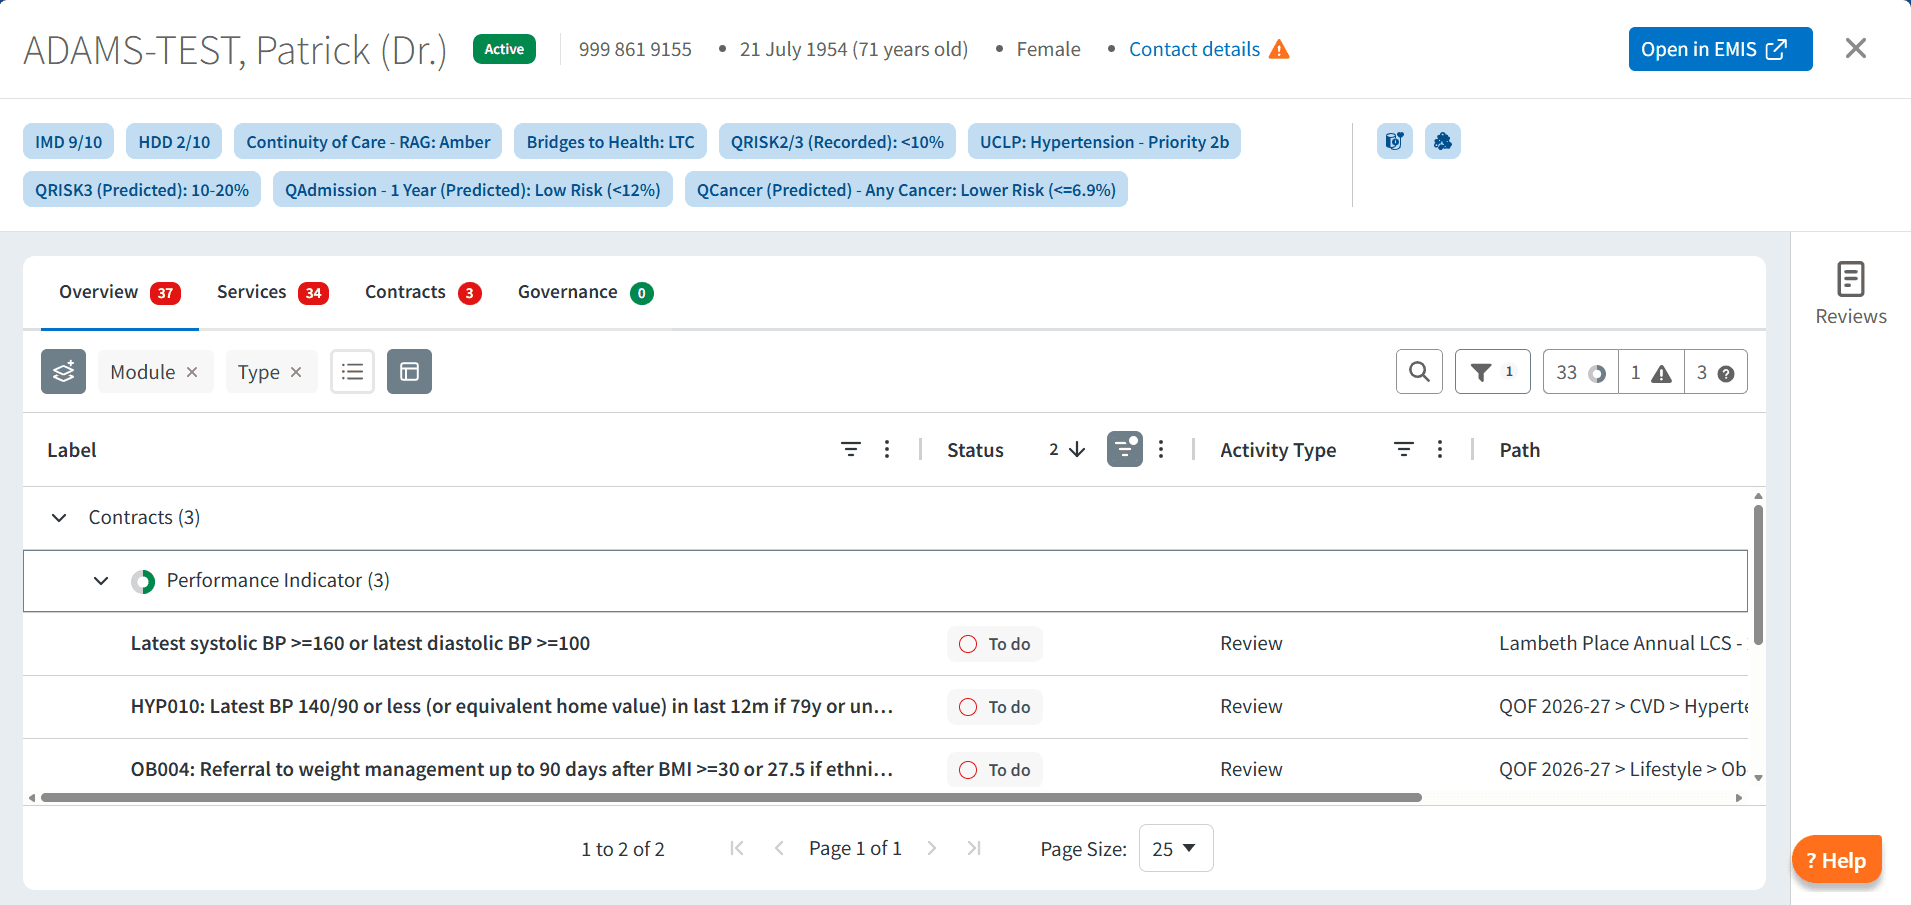
Performance Indicators
Performance Indicators support monitoring of key cancer care components, such as:
Diagnosis coding completeness.
Documentation of cancer reviews or follow‑up.
Care coordination indicators where applicable.
Reviewing performance indicators:
Indicators are categorised by diagnosis, review, target or screening.
Green bars display percentage completion.
The Remaining column highlights outstanding care.
Click View and select Show remaining only to prioritise follow‑up.
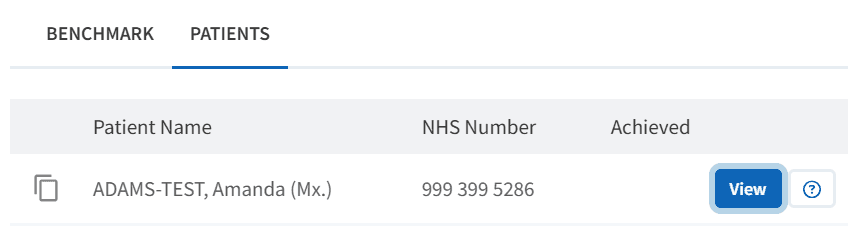
Above the patient list, select Show remaining only to review outstanding care.
⚠️ Please note: Patient-level data can be exported. Refer to this support article for further information.
Patient View for Follow‑up
The Patient View functionality supports individual patient‑level follow‑up within cancer care pathways.
To access Patient View:
Click View next to the patient’s NHS number.
Within Patient View you can:
View all Ardens Manager findings for the patient.
Identify outstanding review or follow‑up actions.
Use this as a prompt prior to reviewing the full clinical record.
To take action:
Click Open in EMIS / SystmOne to access the clinical record.
Review cancer history, current status and follow‑up needs.
Consider patient preference and clinical context.
Complete any required actions in the clinical system.
❓ FAQs
Why does the dashboard focus on the "top 10 cancers"?
The Cancer dashboards include individual registers for the top 10 cancers, based on NICE guidance, as these represent the cancers with the highest prevalence and workload impact across primary care.
Given the wide variety of cancer types, this approach enables meaningful, consistent breakdowns focused where patient numbers are highest, clear population‑level insight to support planning and service oversight, and a manageable, user‑friendly dashboard structure.
Patients with less common cancer diagnoses are still fully included within:
The All Cancer register.
The Other Cancers category.
Within Other Cancers, users can explore detailed diagnosis coding using the code breakdowns available within reports, even though these diagnoses are not linked to further condition‑specific breakdowns.
🏫 Additional Support
To further your understanding of the Ardens Manager platform:
Book training for your GP Practice, PCN or ICB.
Complete the Cancer academy module.
Contact our Support Team for support in real time.