
ℹ️ Introduction
This article explains how to use Ardens Manager to support Quality and Outcomes Framework (QOF) delivery. By the end of this article, you will be able to monitor performance, identify areas for improvement, and take action to maximise QOF achievement.
Background
The Quality and Outcomes Framework (QOF) is a national incentive scheme designed to reward GP practices for the quality of care they provide across a range of clinical indicators.
Tracking performance across multiple indicators, alongside maintaining accurate coding, can make it difficult to quickly identify gaps and prioritise action.
How Ardens Can Help
Ardens Manager provides a dedicated QOF Dashboard to support practices and PCNs in monitoring, reviewing, and improving QOF performance.
The dashboard is structured into key areas:
Overview: High-level summary of QOF achievement and points
Performance Indicators: Detailed breakdown of indicators across various clinical domains
Traffic Light System: Quickly identifies indicator status against thresholds
Patient Lists: Identify patients requiring action
Trends: Monitor progress over time
✅Included in Ardens Manager National Content package: Interested in finding out more or requesting a trial? Contact accounts@ardens.org.uk
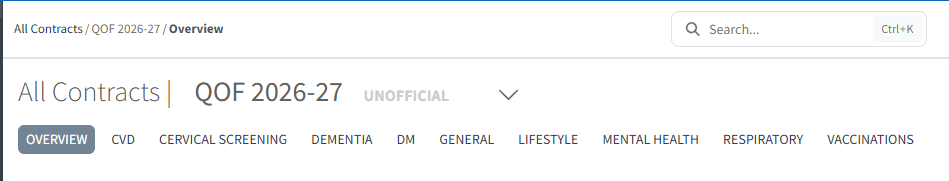
📍 Access the Dashboard
Login to Ardens Manager
Select Contracts from the left-hand panel
Select QOF 2026-27
📊 Monitor Performance
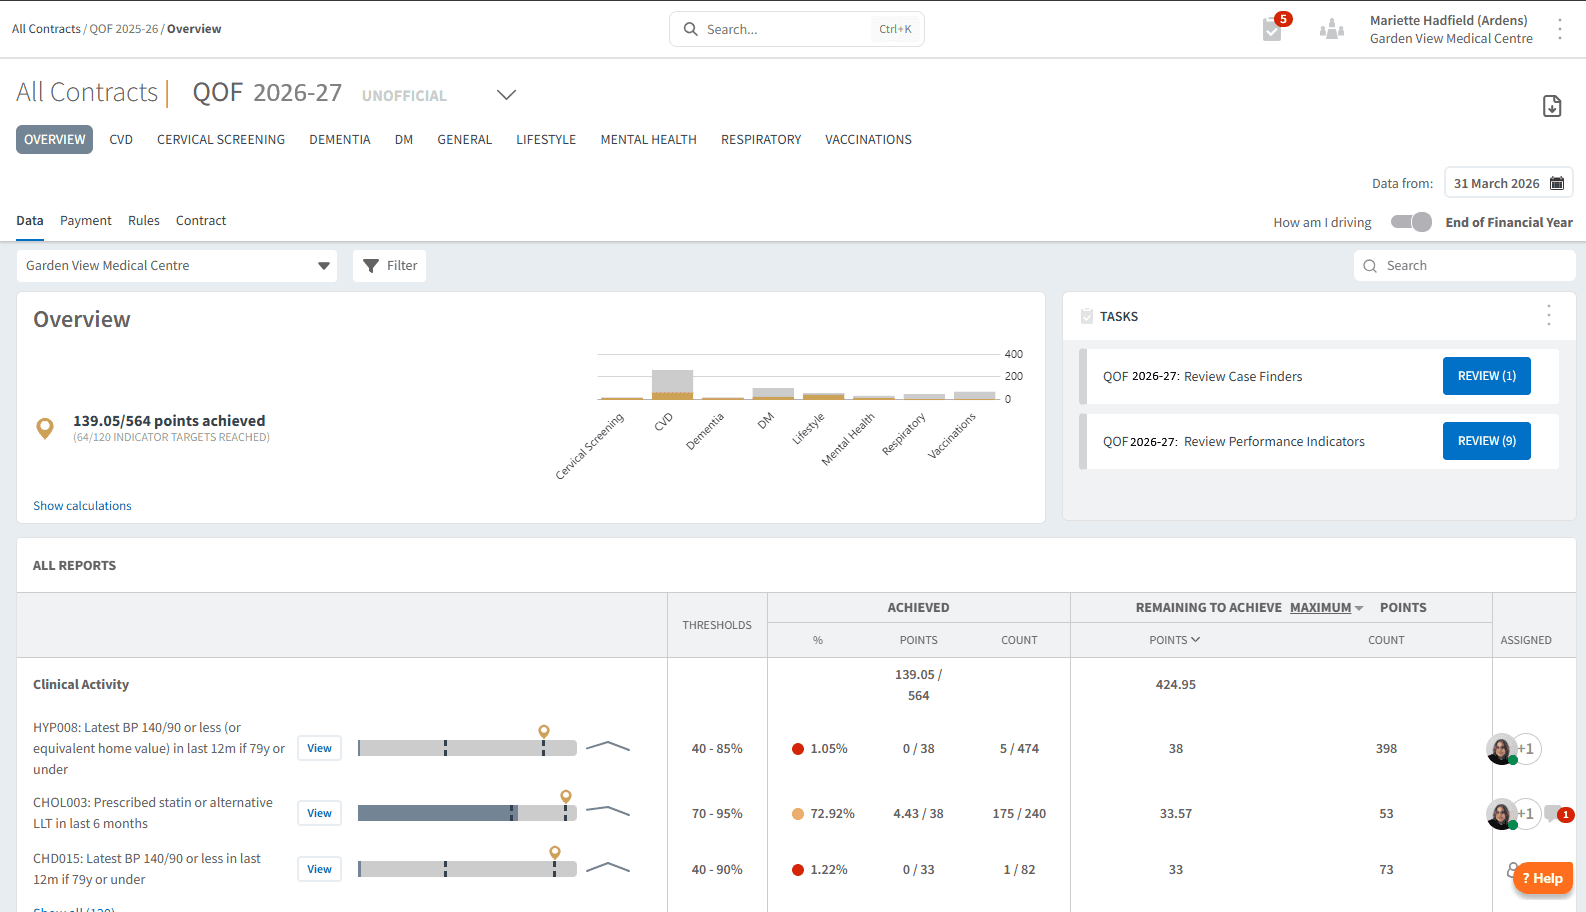
The OVERVIEW section provides a high-level summary of QOF achievement, helping you understand your current position at a glance. This page includes all indicators on a single view.
Use this section to:
Review total points achieved vs available
Understand overall achievement against indicator thresholds
Identify whether performance is on track
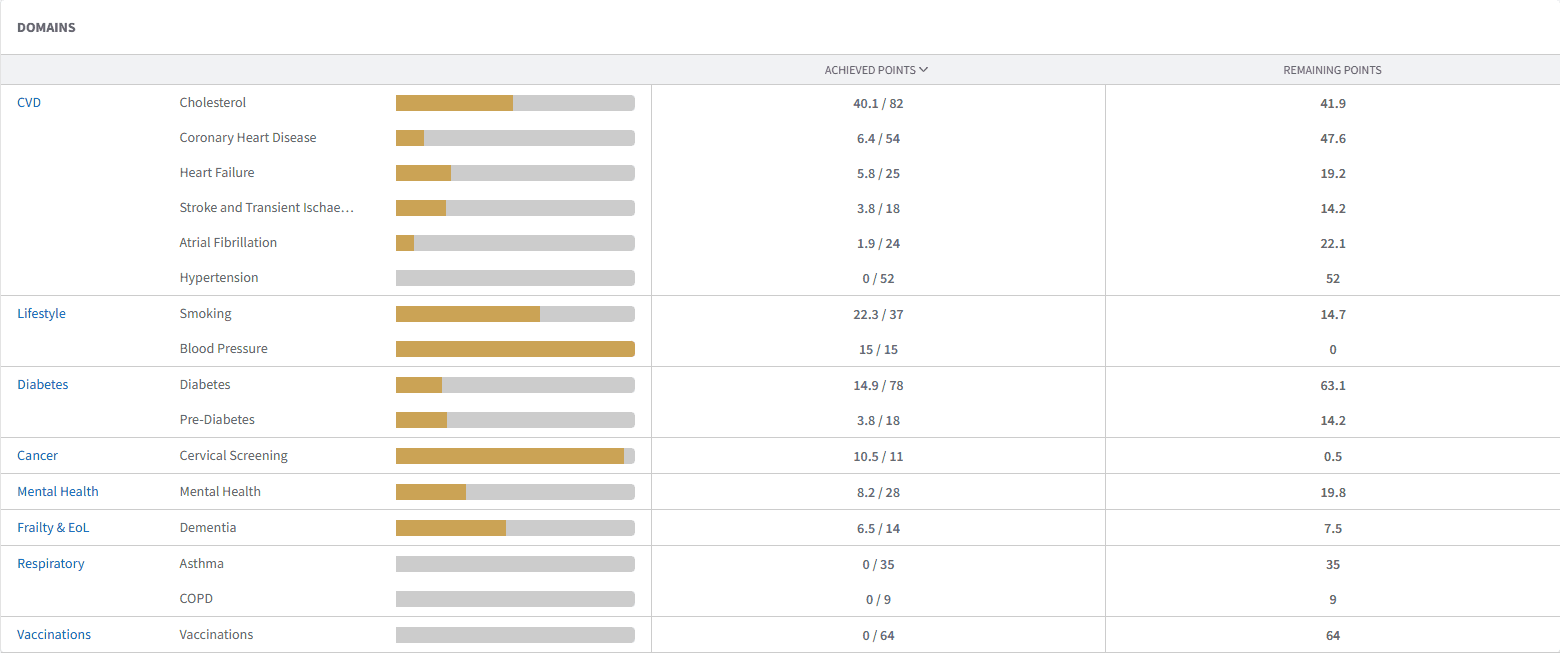
You can use the domain tabs along the top of the dashboard to filter and group reports by domain.
🚦 Track Clinical Indicators
The Clinical Activity section provides a detailed breakdown of performance across clinical activity.
The dashboard features a traffic light system to quickly identify indicator status:
Red: Below the minimum threshold
Amber: Above the minimum threshold and progressing towards the upper threshold (points are being accumulated)
Green: Maximum threshold reached (no further points available)
Each indicator also includes a progress bar, showing how close you are to the next threshold (indicated by dotted lines).

💰 Payment & Achievement
The PAYMENT section provides an overview of expected income based on current QOF achievement, helping you understand how performance translates into financial value.
Use this section to:
Review how points achieved translate into payment
Track estimated vs maximum available income
Identify indicators where improving performance will increase payment
Support financial planning and reporting at Practice or PCN level
This view helps link clinical performance directly to financial outcomes, allowing you to prioritise areas that will have the greatest impact on overall QOF achievement.
To view payment details:
Navigate to the PAYMENT tab within the dashboard
Review the breakdown of points and associated payment values
Use filters to view data at Practice, PCN, or wider organisational level
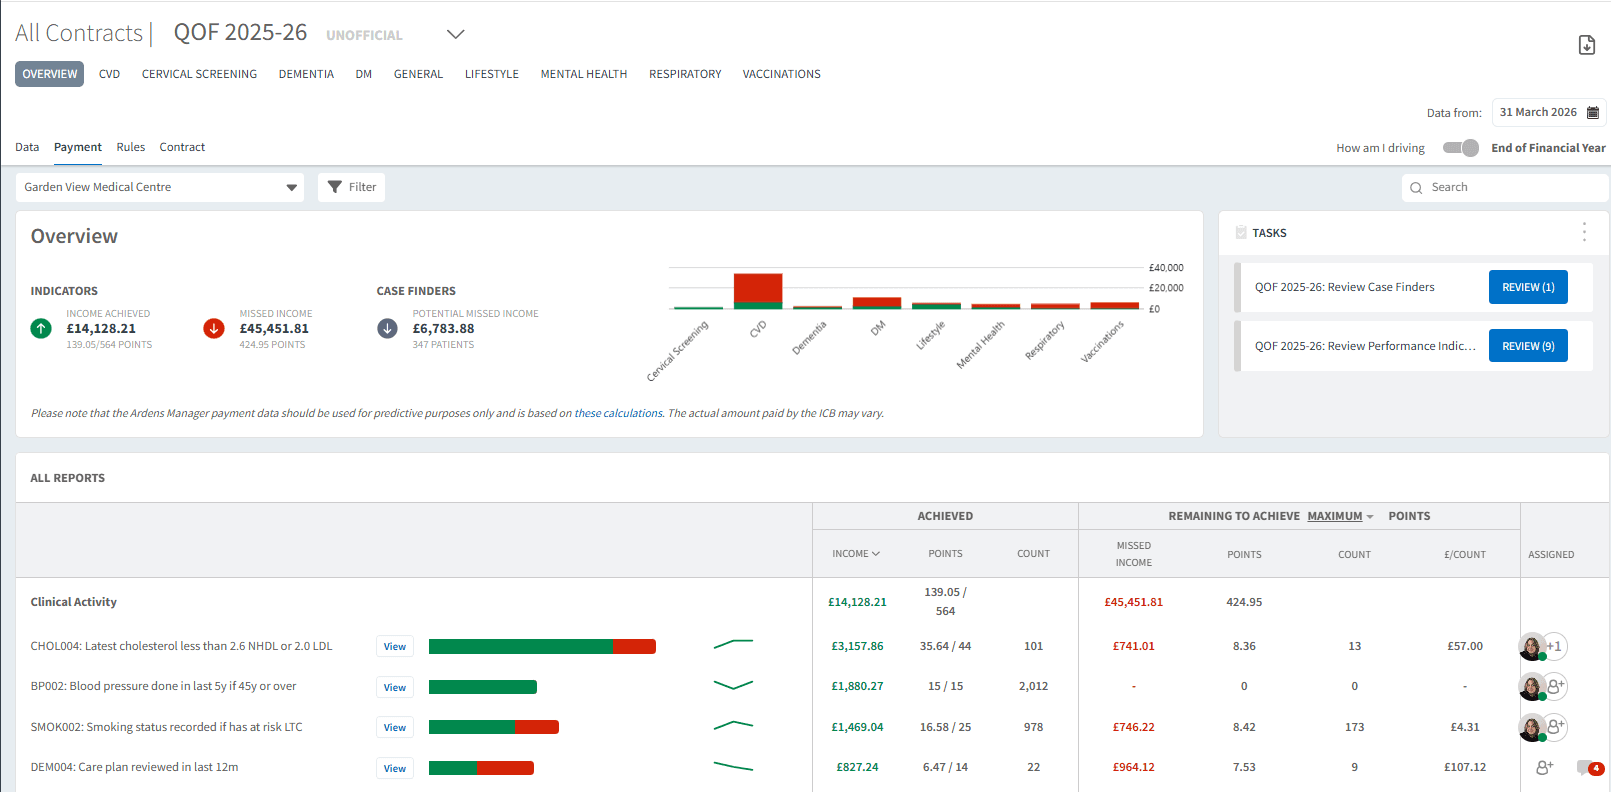
⚠️ Please note: Payment figures are indicative and based on recorded activity and achievement within the system.
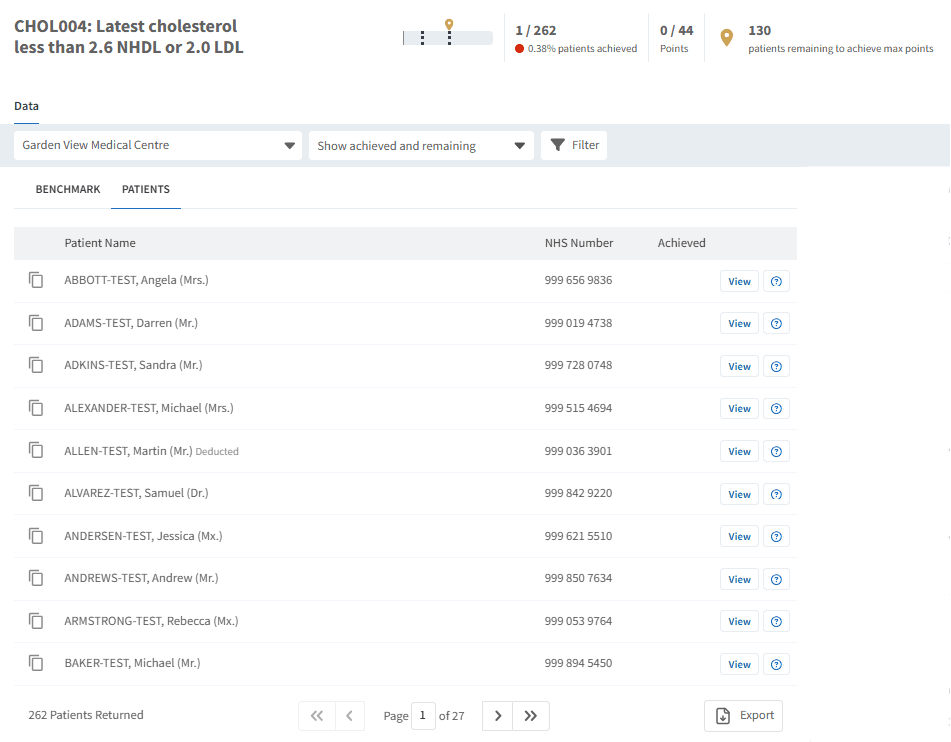
👤 Identify Patients
Ardens Manager allows you to drill down into patient-level data to support follow-up and improvement activity.
Use this to:
Identify patients not meeting indicator criteria
Support recall and targeted interventions
Understand what action is required
To view patient lists:
Click View next to the relevant indicator
Select the PATIENTS tab
Apply filters if required (e.g. Show remaining only)
Export or review patients as needed
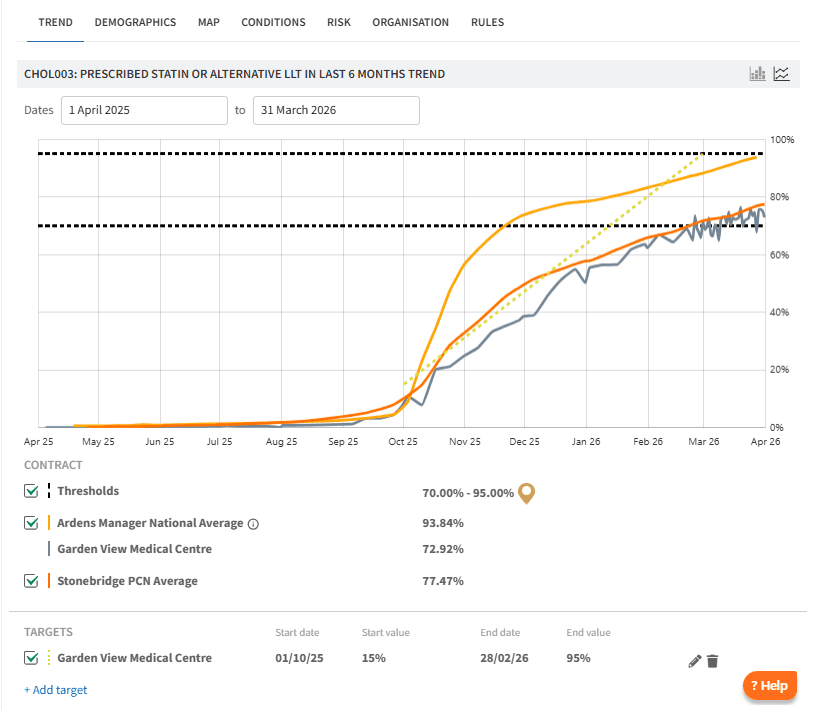
📈 Monitor Progress
The dashboard allows you to track performance over time, supporting ongoing review throughout the QOF year.
Use this section to:
Monitor improvements following interventions
Track trends in achievement
Adjust priorities where needed
To view trends and targets:
Click View next to the relevant indicator
Select the TREND tab
Apply Contract filters if required
Set Personalised Targets as needed
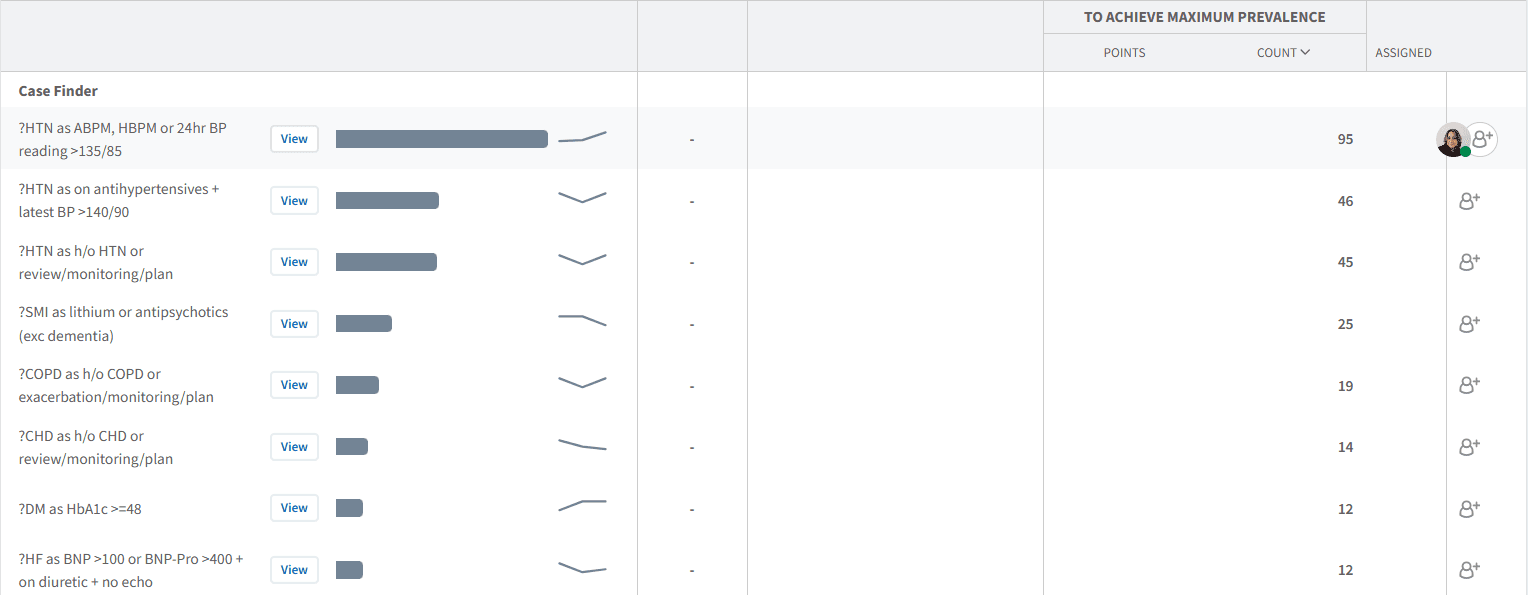
🧩 Case Finding & Data Quality
Data quality plays a key role in maximising QOF achievement. The dashboard can help highlight areas where coding or recording may impact both performance and disease prevalence.
Use this to:
Identify unexpected gaps in prevalence
Review indicators where activity may not be coded correctly
Support data quality improvement and case finding
❓FAQs
How often is QOF data updated?
Data is typically updated daily once automatic uploads are enabled.
Can I access patient-level data?
Yes, where patient-level access is enabled by your organisation
Why does my performance differ from my clinical system?
This may be due to coding differences, data quality issues, or timing of data uploads.
Can I export patient lists?
Yes, patient lists can be exported for further action or use in clinical systems.
🏫 Additional Support
To further your understanding of the Ardens Manager platform:
Book training for your GP Practice, PCN or ICB
Complete the QOF academy module
Contact our Support Team for support in real time