
ℹ️ Introduction
This article explains how to use the Disease Prevalence tab within the Population Dashboard in Ardens Manager to understand the prevalence of long-term conditions across your practice population. By the end of this article, you will be able to identify current disease prevalence, explore trends over time, and compare your data against other practices within your PCN.
Background
Disease prevalence refers to the proportion of patients within a practice population who have a specific condition at a given time. Monitoring prevalence can help practices understand population health needs, support service planning, and provide insight into areas such as long-term condition management and QOF performance.
Disease prevalence is also an important component of QOF, as prevalence can influence payment calculations and help practices understand the scale of long-term condition management required across their population.
How Ardens Can Help
Ardens Manager includes a dedicated Disease Prevalence tab within the Population Dashboard, allowing practices to:
View prevalence across multiple disease areas
Explore condition-specific patient counts
Monitor prevalence trends over time
Compare prevalence against practices across the PCN (subject to data sharing agreements)
Understand patient demographics for specific cohorts
✅Included in Ardens Manager National Content package: Interested in finding out more or requesting a trial? Contact accounts@ardens.org.uk
📍 Access the Dashboard
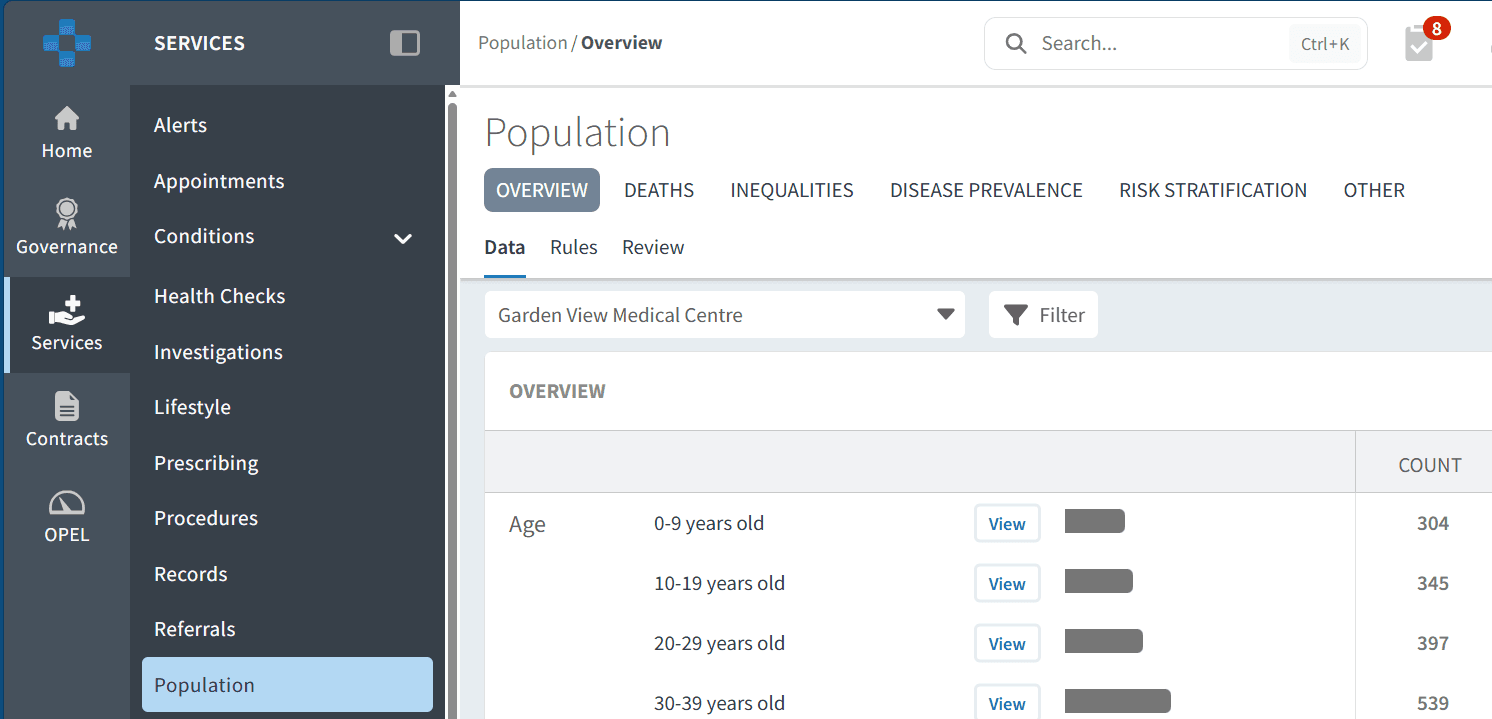
Login to Ardens Manager.
Select Services from the left-hand panel.
Select Population.
Select the Disease Prevalence tab.
🔎 Identify Current Prevalence
The Disease Prevalence dashboard provides an overview of patients currently recorded on disease registers across a range of long-term conditions.
Understanding your current prevalence can help support:
Workforce and service planning
Long-term condition management
Population health reviews
Identification of variation across disease areas
View Disease Areas
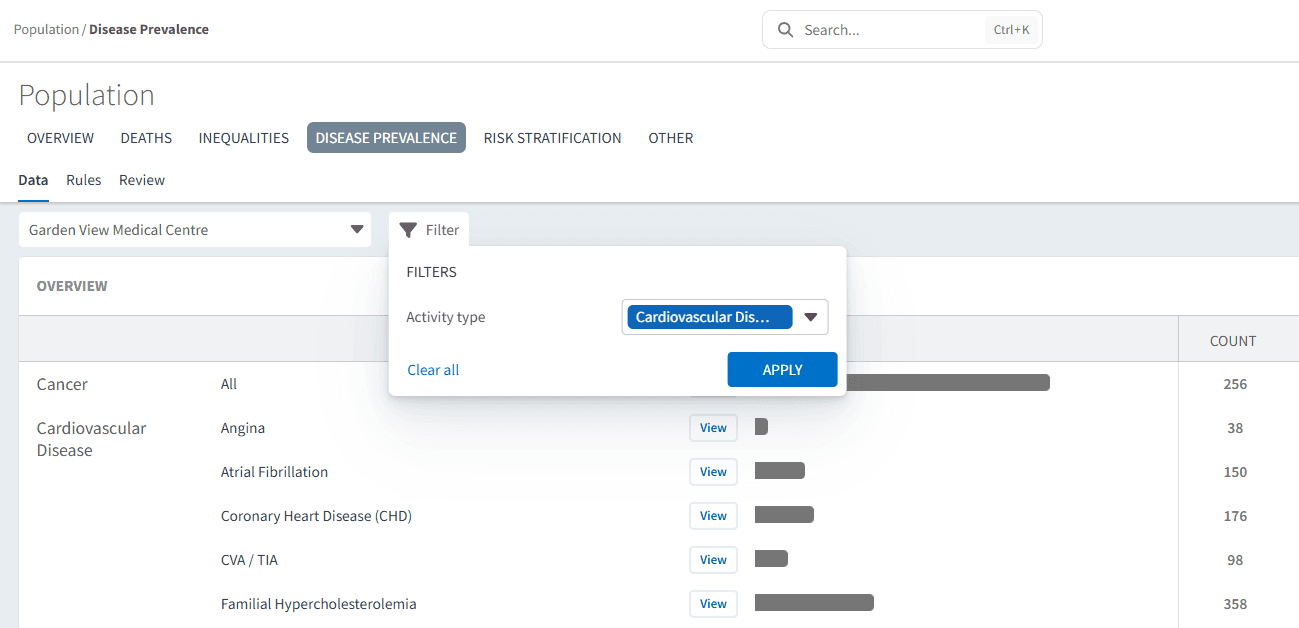
The dashboard is grouped by disease area and then broken down into individual conditions within that category.
For example:
Cardiovascular Disease
Atrial Fibrillation
Coronary Heart Disease
Heart Failure
To identify a condition:
Scroll to the relevant disease area
Locate the condition you want to review
Review the value displayed within the Count column
Alternatively, you can use the filter icon to narrow the dashboard by disease area:
Select the filter icon
Choose the relevant activity type
Click Apply
Open Detailed Condition Data
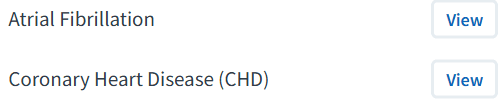
To explore a condition in more detail click View next to the condition.
This opens a more detailed breakdown of the selected register, including benchmarking, trends, and demographics.
📈 Analyse Trends
Once inside a condition view, Ardens Manager provides additional tools to help practices understand how prevalence is changing over time and how it compares across the wider PCN.
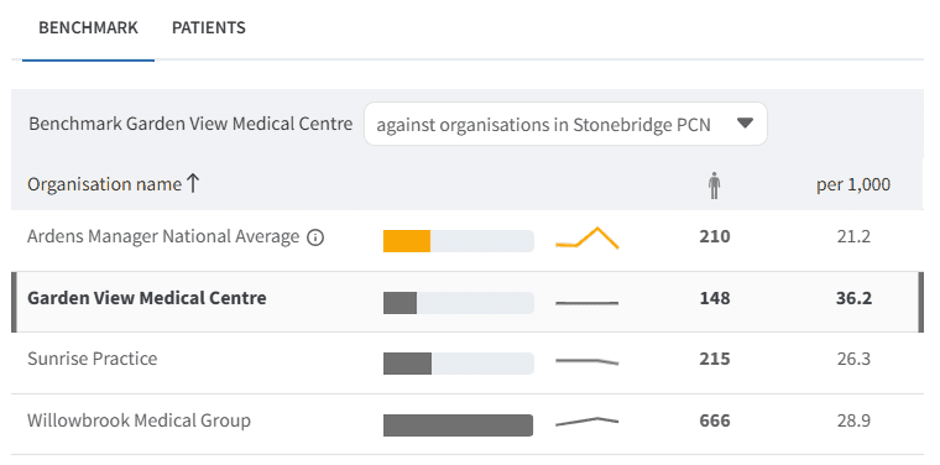
Benchmark Practices
Use the Benchmark tab to compare your prevalence against other practices within your PCN (subject to data sharing agreements).
This can help identify:
Variation between practices
Potential differences in coding or case identification
Areas that may require further review
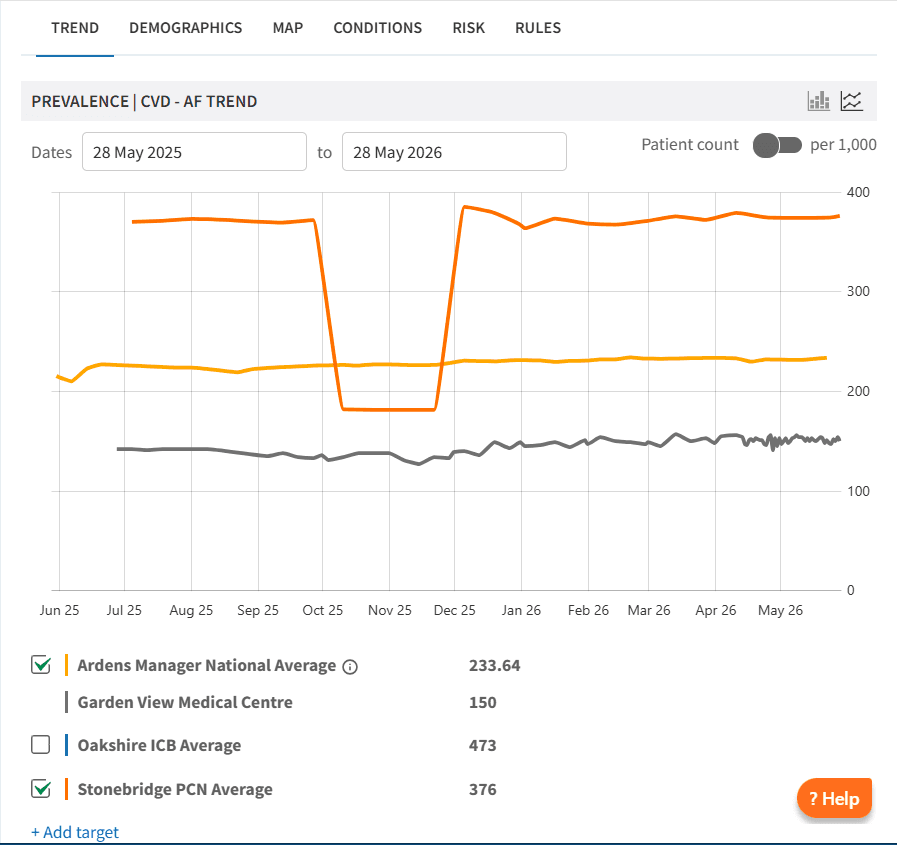
Review Prevalence Trends
Use the Trend tab to visualise changes in prevalence over time.
This may help practices understand:
Whether disease registers are increasing or decreasing
The impact of local initiatives or coding changes
Emerging population health trends
👥 Understand Patient Cohorts
The condition view includes several analytical tabs to help users better understand the patients within a disease register. These include demographics, condition breakdown, risk stratification, and geographical mapping.
Together, these views can support:
Capacity and workforce planning
Understanding patient complexity
Identifying higher risk patients
Planning proactive care initiatives
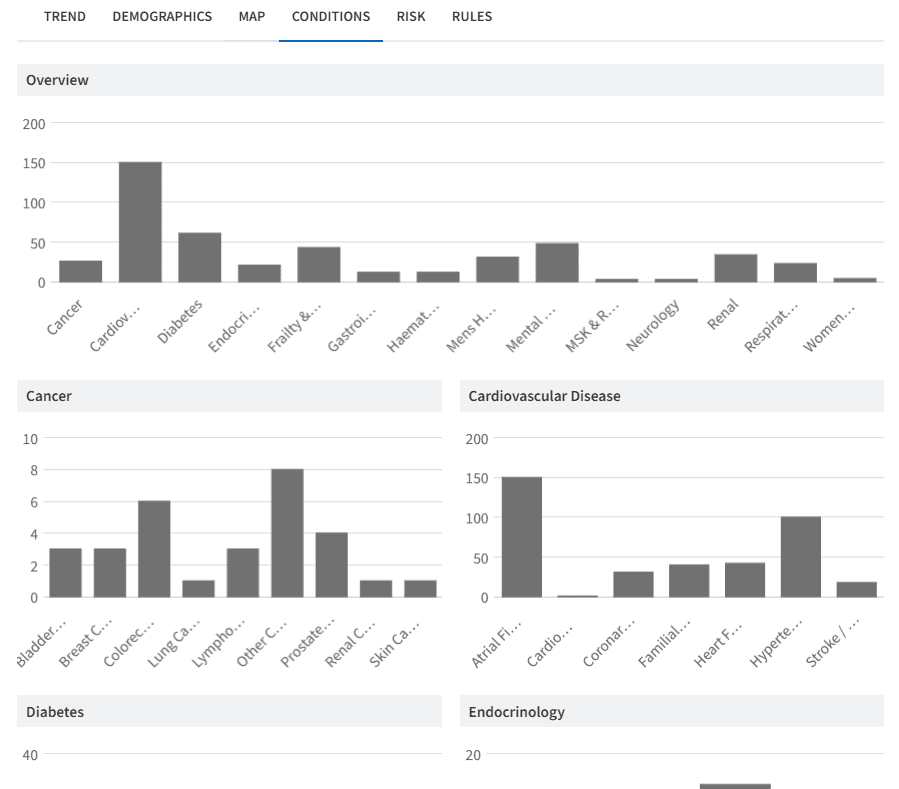
Explore Condition Breakdown
Use the Condition tab to understand what other long-term conditions are commonly recorded across the selected patient cohort.
This can help practices:
Understand levels of multimorbidity
Identify patients with more complex health needs
Support integrated or proactive care planning
Review Risk Stratification
The Risk tab brings together a range of risk stratification tools and indicators available within Ardens Manager, helping to identify patients who may benefit from additional support or proactive intervention.
This can support:
Identification of higher risk patients
MDT or proactive care planning
Prioritisation of limited clinical capacity
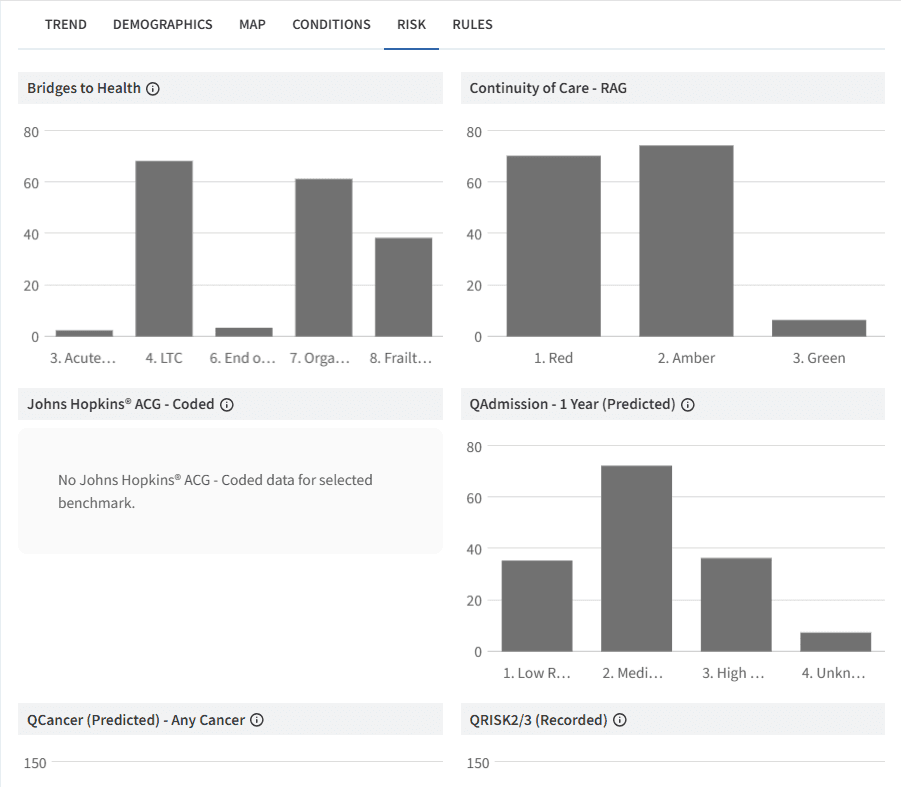
Additional tabs such as Demographics and Map can also be used to further understand the makeup and geographical distribution of patients within the selected condition register.
❓ FAQs
Can I compare my practice against other practices?
Yes. The Benchmark tab allows comparison against practices within your PCN, subject to data sharing agreements being in place.
Does this dashboard help identify missing patients from disease registers?
The Disease Prevalence dashboard is designed to help practices understand current prevalence and trends. To identify potential patients missing from disease registers, please refer to the QOF Case Finder resources available within Ardens Manager.
Can I filter the dashboard to a single disease area?
Yes. Use the filter icon to narrow the dashboard to a specific disease area or activity type.
🏫 Additional Support
To further your understanding of the Ardens Manager platform:
Book training for your GP Practice, PCN or ICB.
Review the QOF - Case Finder support article to learn how to improve prevalence.
Contact our Support Team for support in real time.